
Article Categories
- All Categories
-
 Data Structure
-
 Networking
-
 RDBMS
RDBMS
-
 Operating System
-
 Java
Java
-
 MS Excel
-
 iOS
iOS
-
 HTML
HTML
-
 CSS
CSS
-
 Android
-
 Python
-
 C Programming
-
 C++
C++
-
 C#
C#
-
 MongoDB
-
 MySQL
MySQL
-
 Javascript
-
 PHP
PHP
-
 Economics & Finance
Selected Reading
How to increase the X-axis length of histogram in base R?
To increase the X-axis length of histogram in base R, we can use the axis function. The most important thing to remember while using the axis function is mentioning the appropriate sequence based on the values in the vector or in the column of the data frame if a data frame is used.
Example
x<−rnorm(10000,5,2)
hist(x)
Output
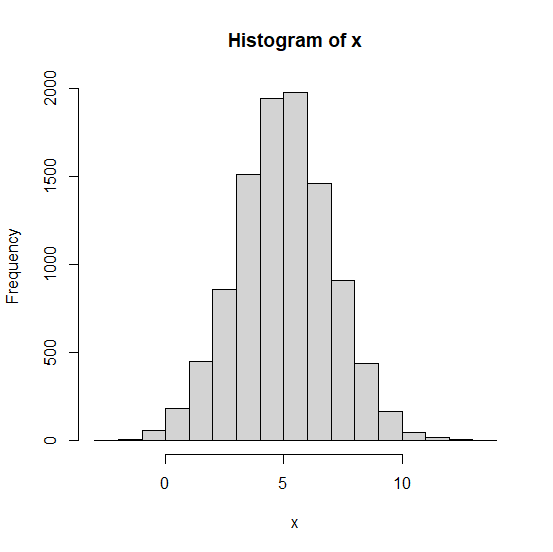
Increasing the X-axis length of histogram −
Example
axis(1,at=seq(−5,15,by=5))
Output


Updated on: 2026-03-11T22:50:55+05:30
6K+ Views

Advertisements