
Article Categories
- All Categories
-
 Data Structure
-
 Networking
-
 RDBMS
RDBMS
-
 Operating System
-
 Java
Java
-
 MS Excel
-
 iOS
iOS
-
 HTML
HTML
-
 CSS
CSS
-
 Android
-
 Python
-
 C Programming
-
 C++
C++
-
 C#
C#
-
 MongoDB
-
 MySQL
MySQL
-
 Javascript
-
 PHP
PHP
-
 Economics & Finance
Selected Reading
How to fill histogram bars using ggplot2 in R with different colors?
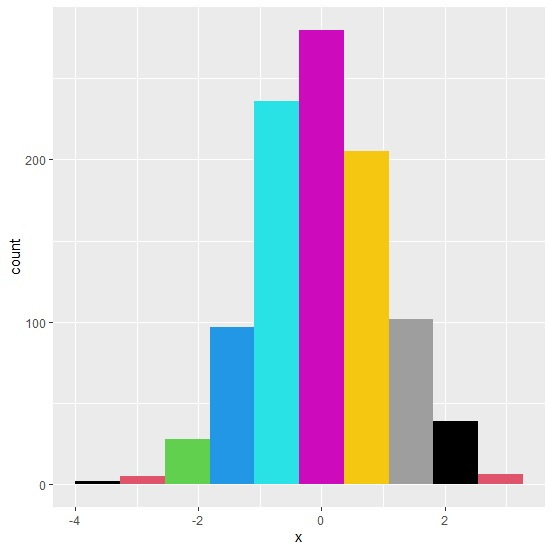
When we create histogram using ggplot2 we need to pass the number of bins we want to have in the histogram and on the basis of these bin numbers the histogram will be created, these bin numbers are actually the number of bars we will have in the histogram. To fill those bars with different colors, we need to use fill argument and pass a range of values equal to the number of bins as shown in the below example.
Consider the below data frame −
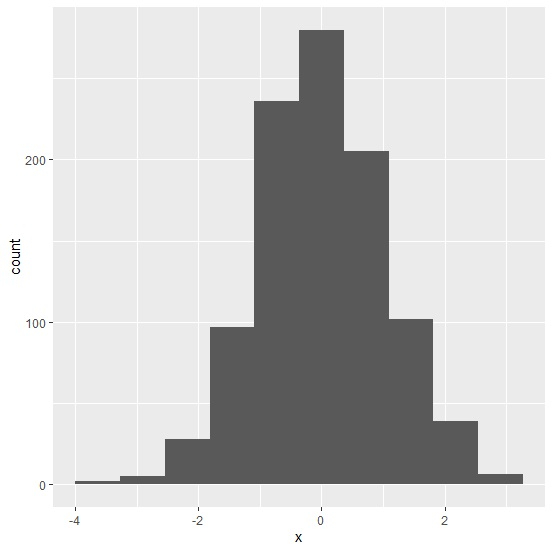
x<-rnorm(1000)
df<-data.frame(x)
Loading ggplot2 package and creating histogram of x −
Example
library(ggplot2)
ggplot(df,aes(x))+geom_histogram(bins=10)
Output
Creating histogram of x with different color in all bars −
Example
ggplot(df,aes(x))+geom_histogram(bins=10,fill=1:10)
Output

Updated on: 2021-02-06T11:17:43+05:30
1K+ Views

Advertisements