
Article Categories
- All Categories
-
 Data Structure
-
 Networking
-
 RDBMS
RDBMS
-
 Operating System
-
 Java
Java
-
 MS Excel
-
 iOS
iOS
-
 HTML
HTML
-
 CSS
CSS
-
 Android
-
 Python
-
 C Programming
-
 C++
C++
-
 C#
C#
-
 MongoDB
-
 MySQL
MySQL
-
 Javascript
-
 PHP
PHP
-
 Economics & Finance
Selected Reading
How to increase the thickness of histogram lines in base R?
To increase the thickness of histogram lines in base R, we would need to use par function by defining the thickness size of the line. If we want to do so then line thickness must be defined first before creating the histogram. An example of line size could be line
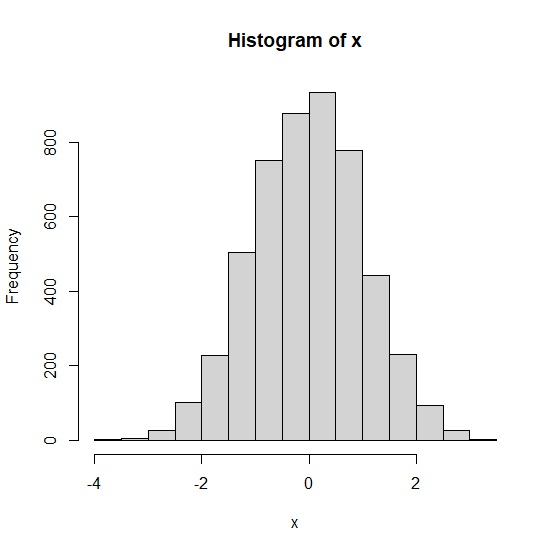
Example
x<-rnorm(5000)
hist(x)
Output
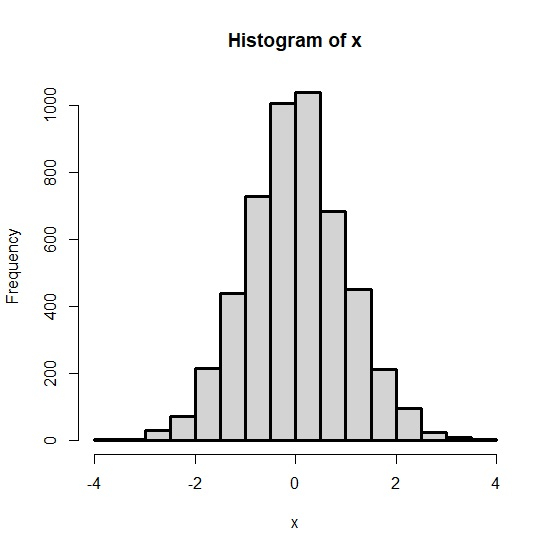
Example
line<-par(lwd=3)
hist(x)
Output

Updated on: 2021-02-08T05:32:14+05:30
2K+ Views

Advertisements