
Article Categories
- All Categories
-
 Data Structure
-
 Networking
-
 RDBMS
RDBMS
-
 Operating System
-
 Java
Java
-
 MS Excel
-
 iOS
iOS
-
 HTML
HTML
-
 CSS
CSS
-
 Android
-
 Python
-
 C Programming
-
 C++
C++
-
 C#
C#
-
 MongoDB
-
 MySQL
MySQL
-
 Javascript
-
 PHP
PHP
-
 Economics & Finance
How to increase the width of lines for histogram like plots in base R?
The histogram like plot in base R is the plots of vertical lines instead of points in a vector or column of a data frame. If we increase the width of these lines then the plot becomes more like a histogram as the increment in widths make the vertical lines look like bars.
To increase the width of lines for histogram like plots in base R, we can use lwd argument.
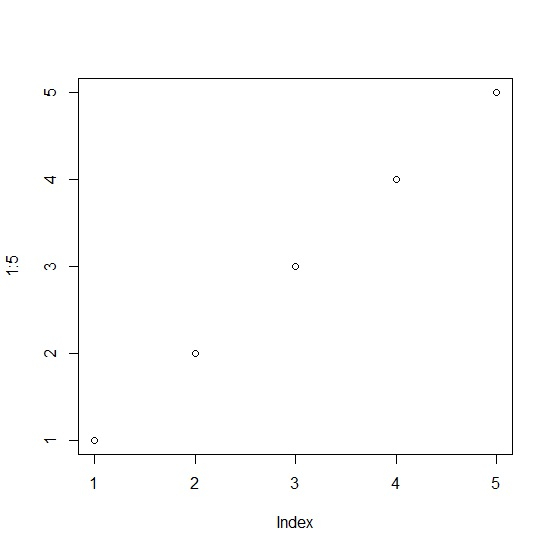
Check out the below example to understand the difference between point chart and histogram like plot in base R.
Example
Use the code given below to increase the width of lines for histogram like plots in base R −
plot(1:5)
Output
If you execute the above given code, it generates the following output −
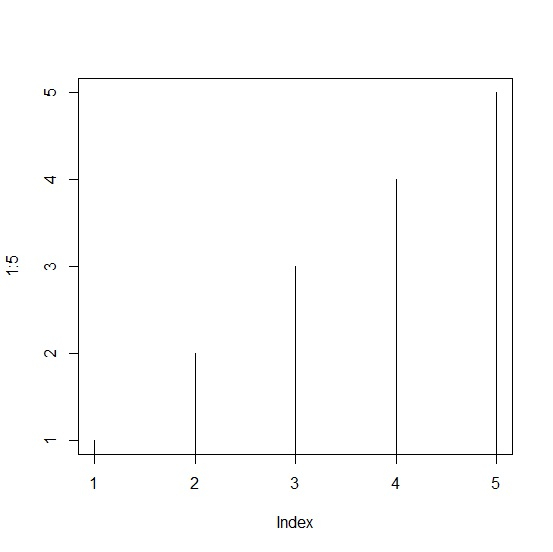
For the histogram like plot, add the following code to the above snippet −
plot(1:5,type="h")
Output
If you execute all the above given snippets as a single program, it generates the following output −
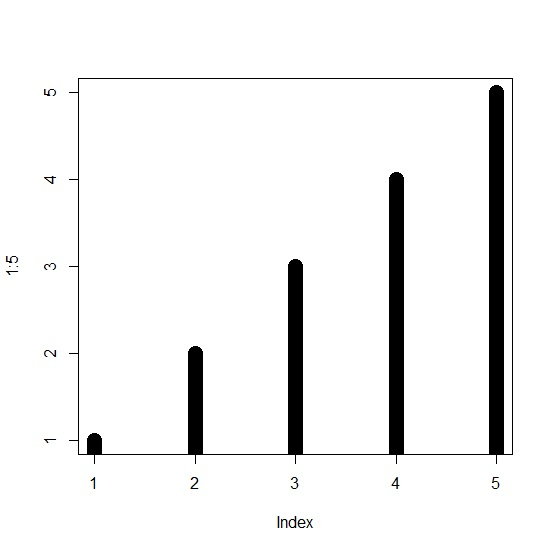
For histogram like plot with larger width of lines, add the following code to the above snippet −
plot(1:5,type="h",lwd=15)
Output
If you execute all the above given snippets as a single program, it generates the following output −

601 Views
