
Article Categories
- All Categories
-
 Data Structure
-
 Networking
-
 RDBMS
RDBMS
-
 Operating System
-
 Java
Java
-
 MS Excel
-
 iOS
iOS
-
 HTML
HTML
-
 CSS
CSS
-
 Android
-
 Python
-
 C Programming
-
 C++
C++
-
 C#
C#
-
 MongoDB
-
 MySQL
MySQL
-
 Javascript
-
 PHP
PHP
-
 Economics & Finance
Selected Reading
How to display zero frequency for bars in base R barplot?
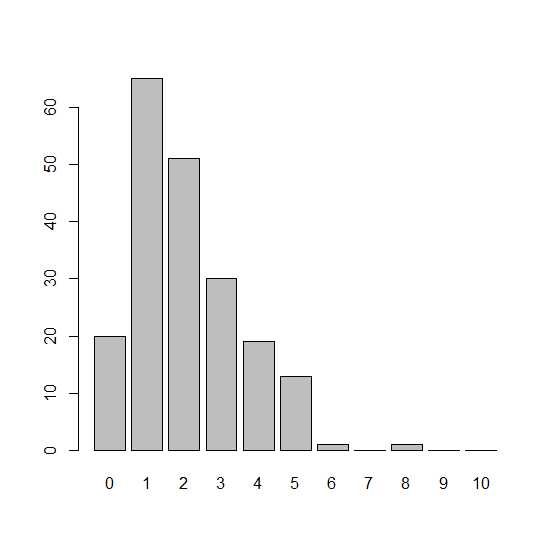
When we create a barplot in base R, the bars are plotted for all the values in the vector but if we have a gap in the values then the bar with zero frequency for that gap is not plotted. For example, if we have a vector called x that contains 100 values consisting of 0, 1, 3 then the barplot will not represent zero frequency for 2. To solve this problem, we can use factor function in the barplot function as shown in the below examples.
Example1
> x<-rpois(200,2)
> x
Output
  [1] 0 1 1 1 3 1 3 1 0 1 1 5 1 8 3 2 3 3 3 3 2 4 2 0 5 3 1 0 1 1 4 1 4 2 3 1 3
 [38] 1 4 2 2 5 1 2 5 2 3 1 1 0 1 1 2 3 4 3 1 1 2 1 2 5 1 1 3 3 1 3 1 3 0 4 1 1
 [75] 2 2 5 2 2 1 2 2 3 1 4 2 1 3 2 0 2 1 0 4 1 5 2 3 2 0 1 1 1 1 2 3 1 3 1 3 2
[112] 3 2 4 4 1 1 0 2 6 1 4 0 5 0 1 2 2 2 3 5 2 2 2 1 4 2 2 1 0 0 1 4 4 1 3 5 1
[149] 1 5 1 2 0 1 2 2 1 1 2 1 0 5 2 3 2 3 1 4 1 2 2 1 1 1 0 0 2 0 1 2 3 4 4 4 2
[186] 2 2 1 1 1 1 4 3 2 2 2 1 0 5 2
Example
> barplot(table(factor(x,levels=0:10)))
Output
Example2
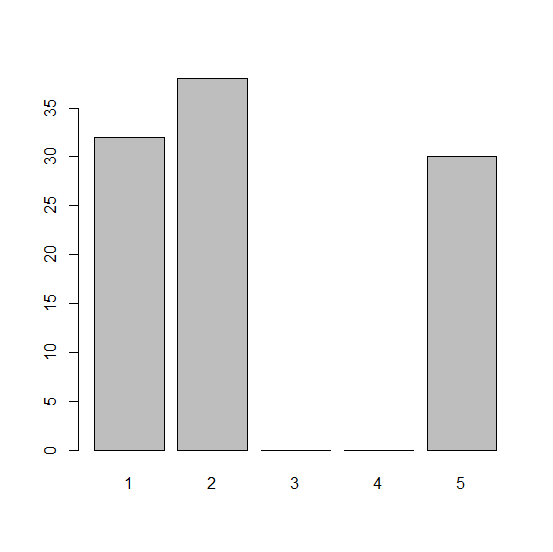
> y<-sample(c(1,2,5),100,replace=TRUE)
> barplot(table(factor(y,levels=1:5)))
Output

Updated on: 2026-03-11T22:50:56+05:30
933 Views

Advertisements