
Article Categories
- All Categories
-
 Data Structure
-
 Networking
-
 RDBMS
RDBMS
-
 Operating System
-
 Java
Java
-
 MS Excel
-
 iOS
iOS
-
 HTML
HTML
-
 CSS
CSS
-
 Android
-
 Python
-
 C Programming
-
 C++
C++
-
 C#
C#
-
 MongoDB
-
 MySQL
MySQL
-
 Javascript
-
 PHP
PHP
Selected Reading
How to remove Index in base R plot?
When we do not pass any title for X-axis then the default is Index and if we want to remove it then xlab argument needs to be used inside the plot function.
For example, if we want to create a plot of first hundred values without Index on X-axis then we can use the command mentioned below −
plot(1:100,xlab="")
Example
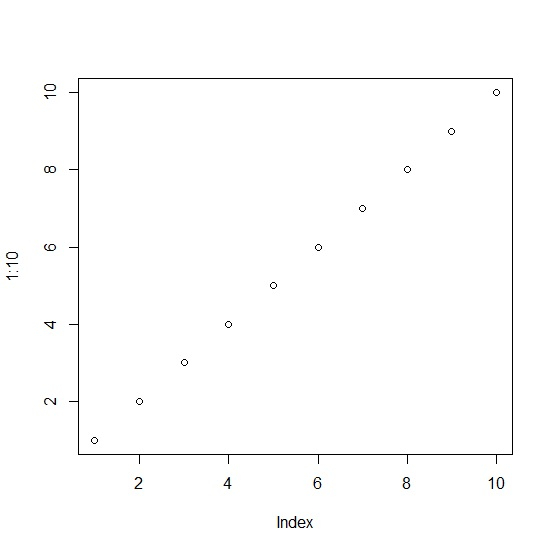
To remove Index in base R plot, use the code given below −
plot(1:10)
Output
If you execute the above given code, it generates the following output −
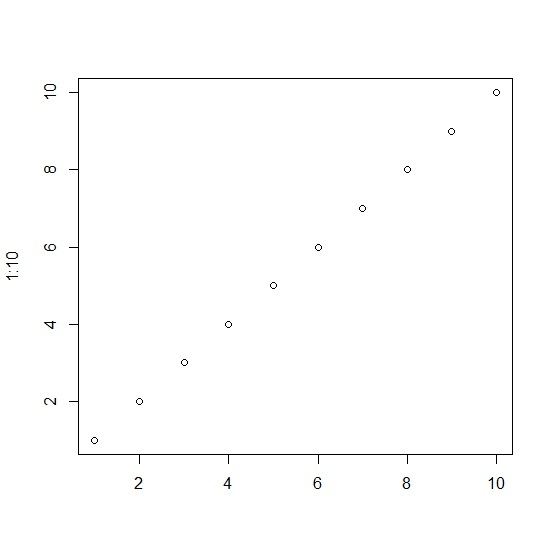
To remove Index in base R plot, add the following code to the above code −
plot(1:10,xlab="")
Output
If you execute all the above given codes as a single program, it generates the following output −

Updated on: 2021-11-06T06:39:42+05:30
693 Views

Advertisements