
Article Categories
- All Categories
-
 Data Structure
-
 Networking
-
 RDBMS
RDBMS
-
 Operating System
-
 Java
Java
-
 MS Excel
-
 iOS
iOS
-
 HTML
HTML
-
 CSS
CSS
-
 Android
-
 Python
-
 C Programming
-
 C++
C++
-
 C#
C#
-
 MongoDB
-
 MySQL
MySQL
-
 Javascript
-
 PHP
PHP
-
 Economics & Finance
How to change the color of bars in base R barplot?
To change the color of bars in base R barplot, we can use col argument inside the barplot function.
For example, if we have a vector called V for which we want to create the barplot then we can use the command given below to get the bars in blue color −
barplot(V,col="blue")
Check out the below example to understand how it can be done.
Example
To change the color of bars in base R barplot, use the code given below −
x<-rpois(10,5)
x
If you execute the above given code, it generates the following output −
[1] 4 3 2 8 2 8 4 2 3 5
To change the color of bars in base R barplot, add the following code to the above code −
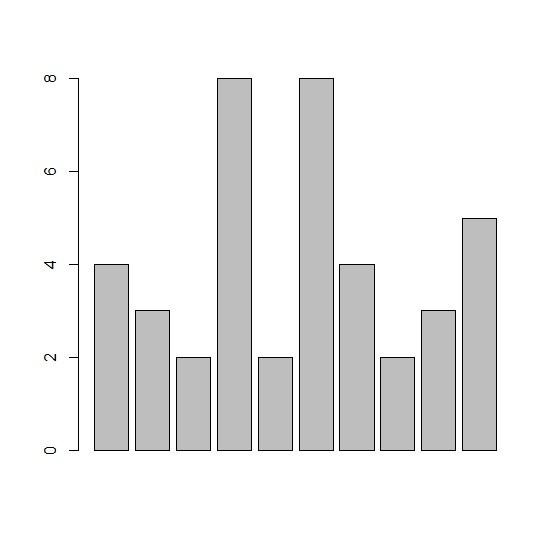
x<-rpois(10,5)
barplot(x)
Output
If you execute all the above given snippets as a single program, it generates the following output −
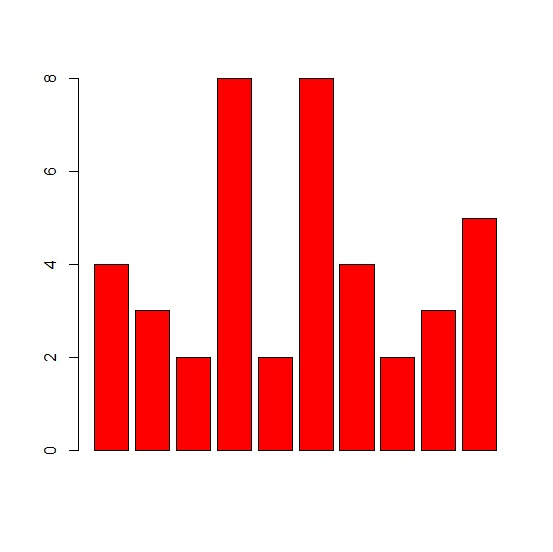
To change the color of bars in base R barplot, add the following code to the above code −
x<-rpois(10,5)
barplot(x,col="red")
Output
If you execute all the above given snippets as a single program, it generates the following output −
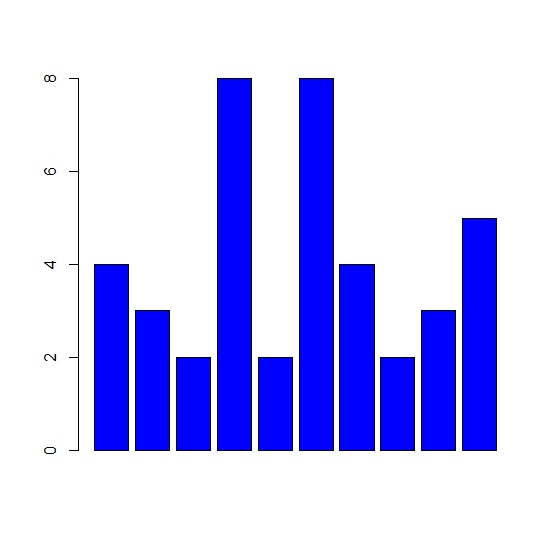
To change the color of bars in base R barplot, add the following code to the above code −
x<-rpois(10,5)
barplot(x,col="blue")
Output
If you execute all the above given snippets as a single program, it generates the following output −

2K+ Views
