- Excel Data Analysis - Home
- Data Analysis - Overview
- Data Analysis - Process
- Excel Data Analysis - Overview
- Working with Range Names
- Tables
- Cleaning Data with Text Functions
- Cleaning Data Contains Date Values
- Working with Time Values
- Conditional Formatting
- Sorting
- Filtering
- Subtotals with Ranges
- Quick Analysis
- Lookup Functions
- PivotTables
- Data Visualization
- Data Validation
- Financial Analysis
- Working with Multiple Sheets
- Formula Auditing
- Inquire
- Advanced Data Analysis - Overview
- Data Consolidation
- What-If Analysis
- What-If Analysis with Data Tables
- What-If Analysis Scenario Manager
- What-If Analysis with Goal Seek
- Optimization with Excel Solver
- Importing Data into Excel
- Data Model
- Exploring Data with PivotTables
- Exploring Data with Powerpivot
- Exploring Data with Power View
- Exploring Data Power View Charts
- Exploring Data Power View Maps
- Exploring Data PowerView Multiples
- Exploring Data Power View Tiles
- Exploring Data with Hierarchies
- Aesthetic Power View Reports
- Key Performance Indicators
- Excel Data Analysis Resources
- Excel Data Analysis - Quick Guide
- Excel Data Analysis - Resources
- Excel Data Analysis - Discussion
What-If Analysis with Scenario Manager
Scenario Manager is useful in the cases where you have more than two variables in sensitivity analysis. Scenario Manager creates scenarios for each set of the input values for the variables under consideration. Scenarios help you to explore a set of possible outcomes, supporting the following −
- Varying as many as 32 input sets.
- Merging the scenarios from several different worksheets or workbooks.
If you want to analyze more than 32 input sets, and the values represent only one or two variables, you can use Data Tables. Although it is limited to only one or two variables, a Data Table can include as many different input values as you want. Refer to What-If Analysis with Data Tables in this tutorial.
Scenarios
A scenario is a set of values that Excel saves and can substitute automatically on your worksheet. You can create and save different groups of values as scenarios on a worksheet and then switch between these scenarios to view the different results.
For example, you can have several different budget scenarios that compare various possible income levels and expenses. You can also have different loan scenarios from different sources that compare various possible interest rates and loan tenures.
If the information that you want to use in scenarios is from different sources, you can collect the information in separate workbooks, and then merge the scenarios from the different workbooks into one.
After you have all the scenarios you need, you can create a scenario summary report −
- That incorporates information from all the scenarios.
- That lets you compare the scenarios side-by-side.
Scenario Manager
Scenario Manager is one of the What-if Analysis tools in Excel.
To create an analysis report with Scenario Manager, you have to follow these steps −
Step 1 − Define the set of initial values and identify the input cells that you want to vary, called the changing cells.
Step 2 − Create each scenario, name the scenario and enter the value for each changing input cell for that scenario.
Step 3 − Select the output cells, called the result cells that you want to track. These cells contain formulas in the initial set of values. The formulas use the changing input cells.
The Scenario Manager creates a report containing the input and the output values for each scenario.
Initial Values for Scenarios
Before you create several different scenarios, you need to define a set of initial values on which the scenarios will be based.
The steps for setting up the initial values for Scenarios are −
- Define the cells that contain the input values.
- Name the input cells appropriately.
- Identify the input cells with constant values.
- Specify the values for the constant inputs.
- Identify the input cells with changing values.
- Specify the initial values for the changing inputs.
- Define the cells that contain the results. The result cells contain formulas.
- Name the result cells appropriately.
- Place the formulas in the result cells.
Consider the previous example of loan. Now, proceed as follows −
Define a cell for Loan Amount.
This input value is constant for all the scenarios.
Name the cell Loan_Amount.
Specify the value as 5,000,000.
Define the cells for Interest Rate, No. of payments and Type (Payment at the beginning or end of the month).
These input values will be changing across the scenarios.
Name the cells Interest_Rate, NPER and Type.
Specify the initial values for the analysis in these cells as 12%, 360 and 0 respectively.
Define the cell for the EMI.
This is the result value.
Name the cell EMI.
Place the formula in this cell as −
=PMT (Interest_Rate/12, NPER, Loan_Amount, 0, Type)
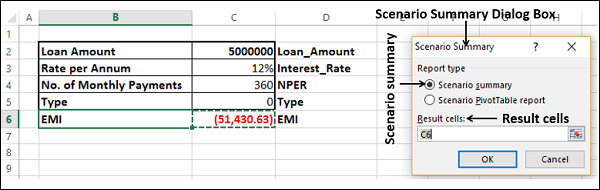
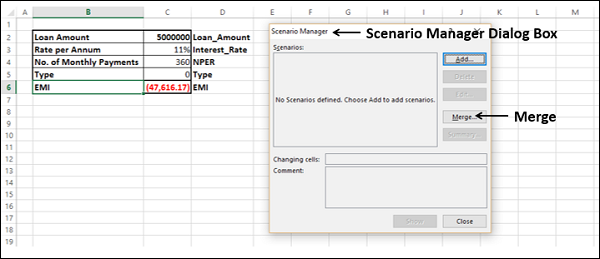
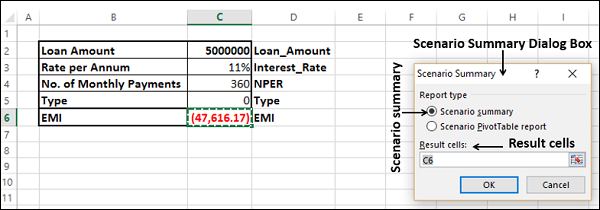
Your worksheet looks as shown below −
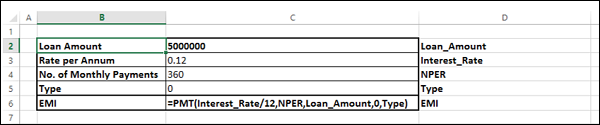
As you can see that the input cells and the result cells are in column C with the names as given in column D.
Creating Scenarios
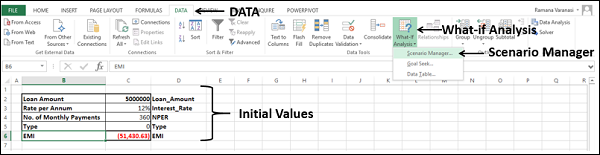
After setting up the initial values for the Scenarios, you can create the scenarios using Scenario Manager as follows −
- Click the DATA tab on the Ribbon.
- Click What-if Analysis in the Data Tools group.
- Select Scenario Manager from the dropdown list.
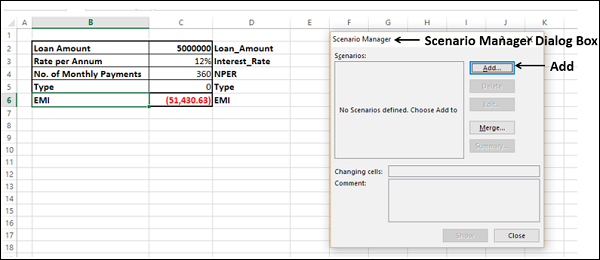
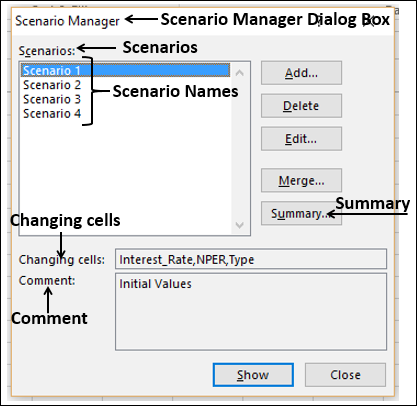
The Scenario Manager Dialog box appears. You can observe that it contains a message −
No Scenarios defined. Choose Add to.
You need to create scenarios for each set of changing values in the Scenario Manager. It is good to have the first scenario defined with initial values, as it enables you to switch back to initial values whenever you want while displaying different scenarios.
Create the first scenario with the initial values as follows −
- Click the Add button in the Scenario Manager Dialog box.
The Add Scenario dialog box appears.
- Under Scenario Name, type Scenario 1.
- Under Changing Cells, enter the references for the cells i.e. C3, C4 and C5 with the Ctrl key pressed.
The name of the dialog box changes to Edit Scenario.
Edit the text in the Comment as Initial Values box.
Select the option Prevent changes under Protection and then click OK.
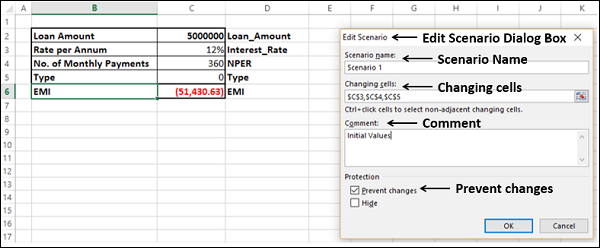
The Scenario Values dialog box appears. The initial values that you have defined appear in each of the changing cells boxes.
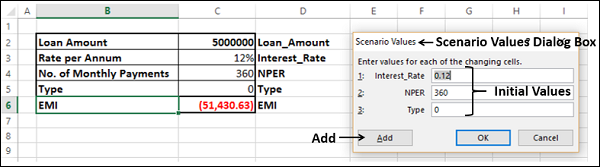
Scenario 1 with the initial values is created.
Create three more scenarios with varying values in the changing cells as follows −
- Click the Add button in the Scenario Values dialog box.
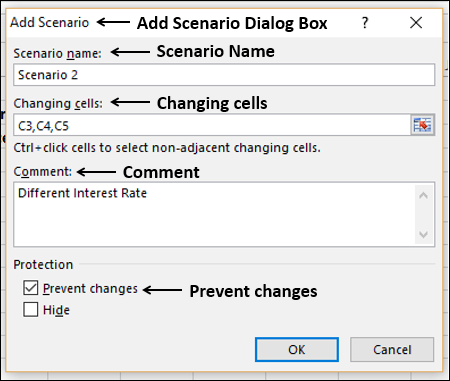
Add Scenario dialog box appears. Note that C3, C4, C5 appear in the Changing cells box.
In the Scenario Name box, type Scenario 2.
Edit the text in the Comment as Different Interest Rate.
Select Prevent changes under Protection and click OK.
The Scenario Values dialog box appears. The initial values appear in the changing cells. Change the value of Interest_Rate to 0.13 and click Add.
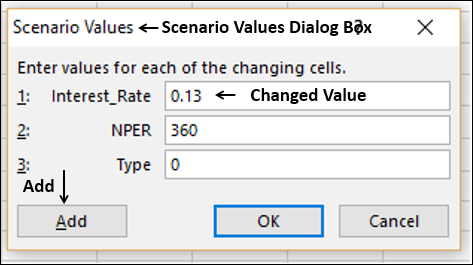
The Add Scenario dialog box appears. Note that C3, C4, C5 appear in the box under changing cells.
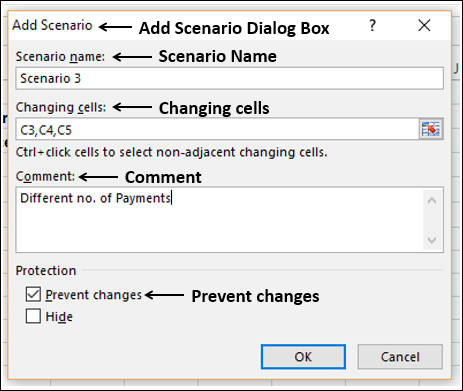
In the Scenario Name box, type Scenario 3.
Edit the text in the Comment box as Different no. of Payments.
Select Prevent changes under Protection and click OK.
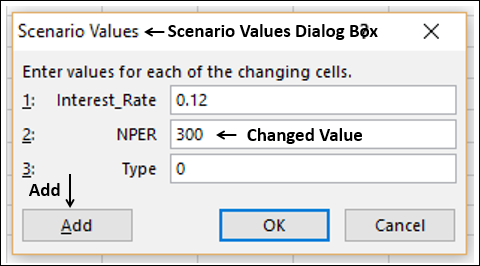
The Scenario Values dialog box appears. The initial values appear in the changing cells. Change the value of NPER to 300 and click Add.
The Add Scenario dialog box appears. Note that C3, C4, C5 appear in the Changing cells box.
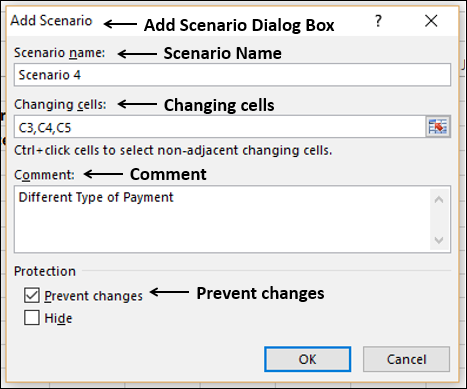
In the Scenario Name box, type Scenario 4.
Edit the text in the Comment box as Different Type of Payment.
Select Prevent changes under Protection and click OK.
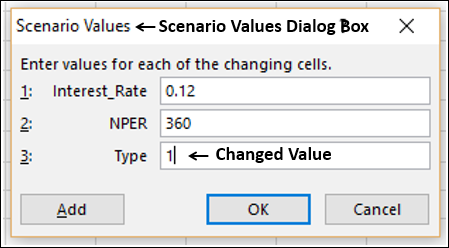
The Scenario Values dialog box appears. The initial values appear in the changing cells. Change the value of Type to 1. Click OK as you have added all the scenarios that you wanted to add.
The Scenario Manager dialog box appears. In the box under Scenarios, You will find the names of all the scenarios that you have created.
- Click Scenario 1. As you are aware, Scenario 1 contains the initial values.
Now, click Summary. The Scenario Summary dialog box appears.
Scenario Summary Reports
Excel provides two types of Scenario Summary reports −
- Scenario summary.
- Scenario PivotTable report.
In the Scenario Summary dialog box, you can find these two Report types.
Select Scenario summary under Report type.
Scenario Summary
In the Result cells box, select the cell C6 (Here, we had put the PMT function). Click OK.
Scenario Summary report appears in a new worksheet. The worksheet is named as Scenario Summary.
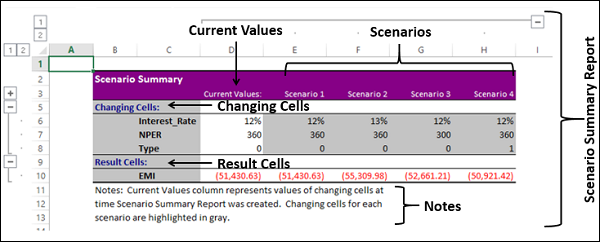
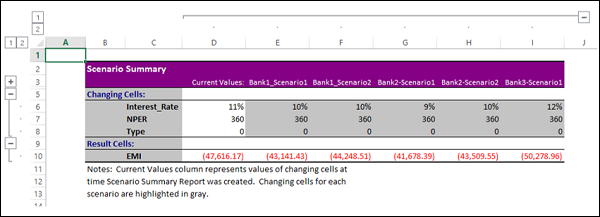
You can observe the following in the Scenario Summary report −
Changing Cells − Enlists all the cells used as changing cells. As you have named the cells, Interest_Rate, NPER and Type, these appear to make the report meaningful. Otherwise, only cell references will be listed.
Result Cells − Displays the result cell specified, i.e. EMI.
Current Values − It is the first column and enlists the values of that scenario which is selected in the Scenario Manager Dialog box before creating the summary report.
For all the scenarios you have created, the changing cells will be highlighted in gray.
In the EMI row, the result values for each scenario will be displayed.
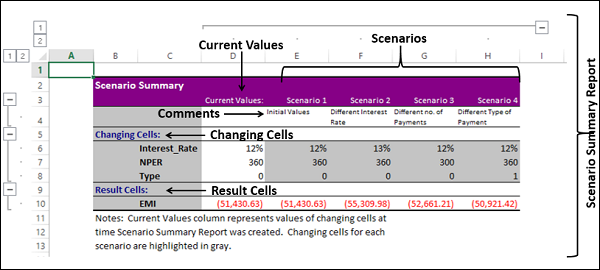
You can make the report more meaningful by displaying the comments that you added while creating the scenarios.
Click the + button to the left of the row containing the scenario names. The comments for the scenarios appear in the row under the scenario names.
Scenarios from Different Sources
Suppose you get the scenarios from three different sources and you need to prepare the Scenario summary report in a Master workbook. You can do this by merging the scenarios from different workbooks into the Master workbook. Follow the steps given below −
Assume that the scenarios are in the workbooks, Bank1_Scenarios, Bank2_Scenarios and Bank3_Scenarios. Open the three workbooks.
Open the Master workbook, in which you have the initial values.
Click DATA > What-if Analysis > Scenario Manager in the Master workbook.
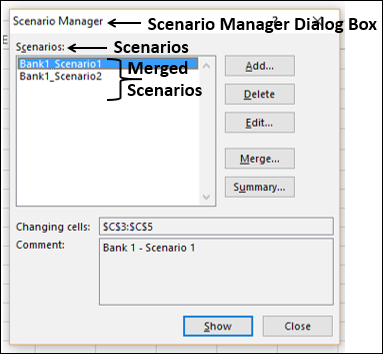
The Scenario Manager Dialog box appears.
As you can observe, there are no scenarios as you have not yet added any. Click Merge.
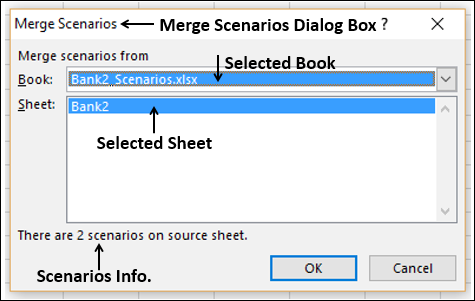
The Merge Scenarios dialog box appears.
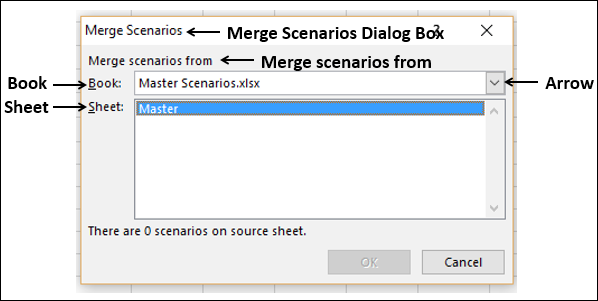
As you can see, under Merge scenarios from, you have two boxes −
- Book
- Sheet
You can select specific worksheet from a specific workbook that contains the scenarios, which you want to add to your results. Click the drop-down arrow of Book to see the workbooks.
Note − The corresponding workbooks should be open to appear in this list.
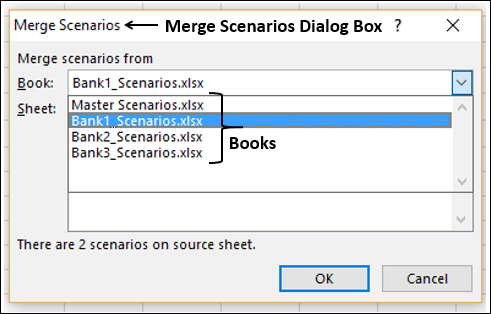
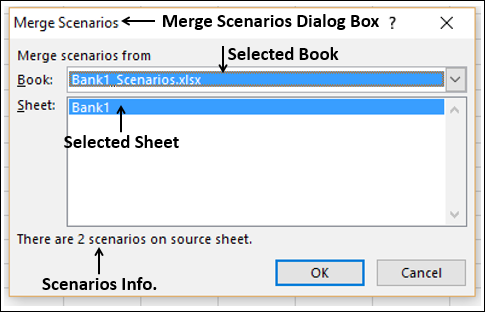
Select the book Bank1_Scenarios.
Bank1 sheet is displayed. At the bottom of the dialog box, the number of scenarios found on source sheet is displayed. Click OK.
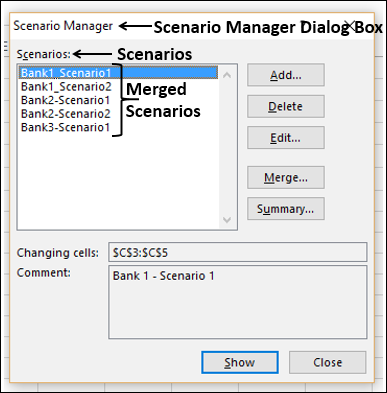
The Scenario Manager dialog box appears. The two scenarios that were merged into the Master workbook will be listed under Scenarios.
Click the Merge button. The Merge Scenarios dialog box appears. Now, select Bank2_Scenarios from the drop-down list in the Book box.
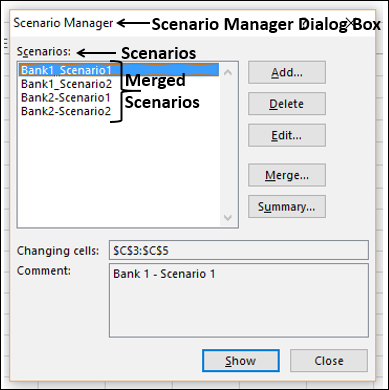
Bank2 sheet is dislayed. At the bottom of the dialog box, the number of scenarios found on source sheet are displayed. Click OK.
The Scenario Manager Dialog box appears. The four scenarios that were merged into the Master workbook are listed under Scenarios.
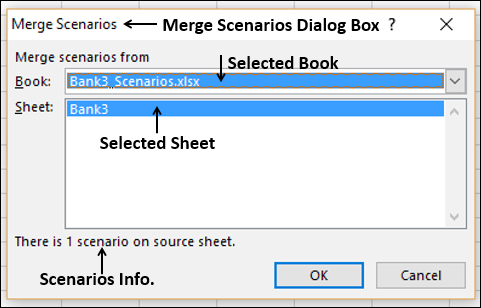
Click the Merge button. The Merge Scenarios dialog box appears. Now, select Bank3_Scenarios from the drop-down list in the Book box.
Bank3 sheet is displayed. At the bottom of the dialog box, the number of scenarios found on source sheet will be displayed. Click OK.
The Scenario Manager Dialog box appears. The five scenarios that were merged into the Master workbook will be listed under Scenarios.
Now, you have all the required scenarios to produce the Scenario summary report.
Click the Summary button. The Scenario Summary dialog box appears.
- Select Scenario summary.
- In the Result cells box, type C6 and click OK.
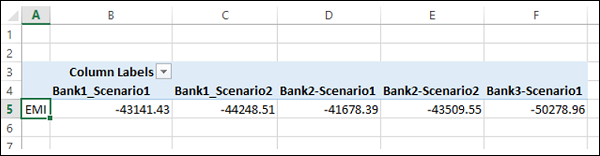
The Scenario summary report appears on a new worksheet in the Master workbook.
Displaying Scenarios
Suppose you are presenting your scenarios and you would like to dynamically switch from one scenario to another and display the set of input values and result values of the corresponding scenario.
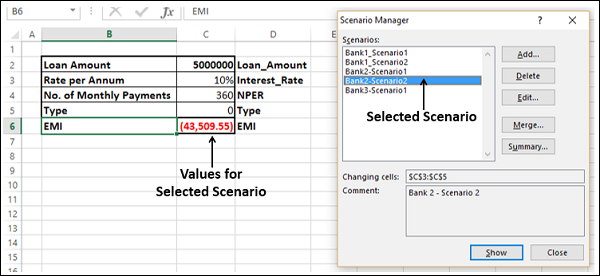
Click DATA > What-if Analysis > Scenario Manager from the Data Tools group. The Scenario Manager Dialog box appears. The list of scenarios appear.
Select the scenario you want to display. Click Show.
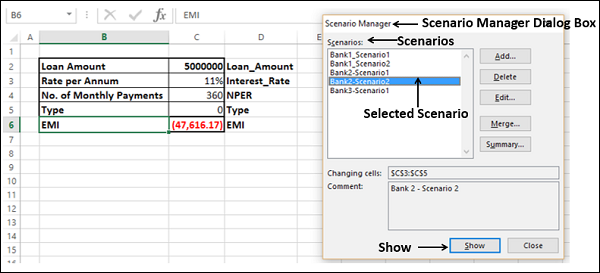
The values on the worksheet are updated to that of the selected scenario. The result values are recalculated.
Scenario PivotTable Report
You can see the Scenario report in the form of a PivotTable also.
Click the Summary button in the Scenario Manager Dialog box. The Scenario Summary dialog box appears.
Select the Scenario PivotTable report under Report type.
Type C6 in the Result cells box.
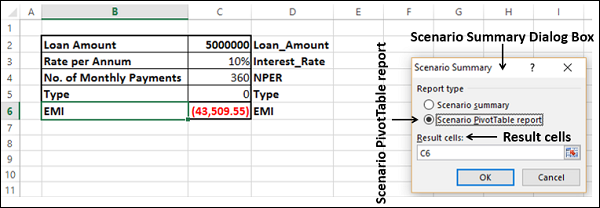
Scenario PivotTable report appears on a new worksheet.