- Excel Data Analysis - Home
- Data Analysis - Overview
- Data Analysis - Process
- Excel Data Analysis - Overview
- Working with Range Names
- Tables
- Cleaning Data with Text Functions
- Cleaning Data Contains Date Values
- Working with Time Values
- Conditional Formatting
- Sorting
- Filtering
- Subtotals with Ranges
- Quick Analysis
- Lookup Functions
- PivotTables
- Data Visualization
- Data Validation
- Financial Analysis
- Working with Multiple Sheets
- Formula Auditing
- Inquire
- Advanced Data Analysis - Overview
- Data Consolidation
- What-If Analysis
- What-If Analysis with Data Tables
- What-If Analysis Scenario Manager
- What-If Analysis with Goal Seek
- Optimization with Excel Solver
- Importing Data into Excel
- Data Model
- Exploring Data with PivotTables
- Exploring Data with Powerpivot
- Exploring Data with Power View
- Exploring Data Power View Charts
- Exploring Data Power View Maps
- Exploring Data PowerView Multiples
- Exploring Data Power View Tiles
- Exploring Data with Hierarchies
- Aesthetic Power View Reports
- Key Performance Indicators
- Excel Data Analysis Resources
- Excel Data Analysis - Quick Guide
- Excel Data Analysis - Resources
- Excel Data Analysis - Discussion
Excel Data Analysis - Subtotals with Ranges
If you have a list of data that you want to group and summarize, you can use Excel Subtotal and Outline to display summary rows or columns. You can use PivotTable also for this purpose, but using Subtotal and Outline is the quickest way to analyze a range of data. Note that Subtotal and Outline can be used only on a range and not on a table.
You can create an Outline of up to eight levels, one for each group. Outer Levels are represented by Lower Numbers and Inner Levels by Higher Numbers. Each inner level displays detailed data for the preceding outer level.
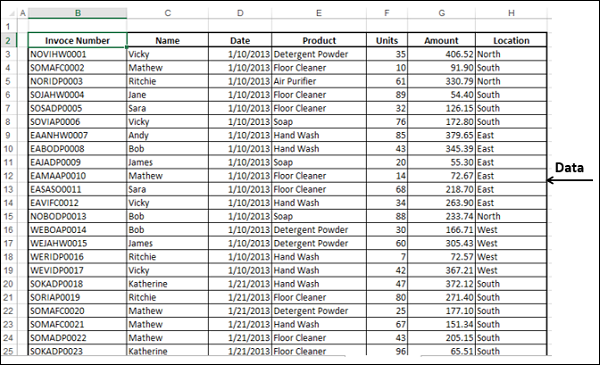
To understand how to use Subtotal and Outline, consider the following example wherein the sales data of various items is given salesperson wise and location wise. In total, there are 1891 rows of data.
Subtotals
You can obtain the sum of sales location wise using Subtotal.
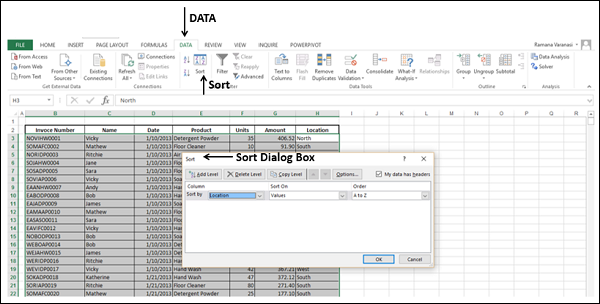
First, sort the data location wise.
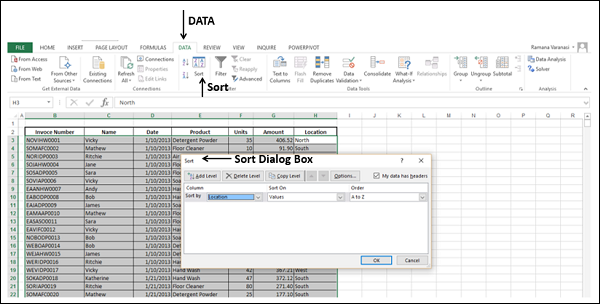
Click anywhere on the data range.
Click the DATA tab.
Click Sort.
Data is selected. The Sort dialog box appears.
In the Sort dialog box,
Select Location for Sort by
Select Values for Sort On
Select A to Z for Order
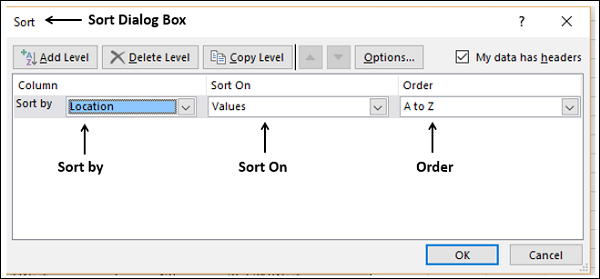
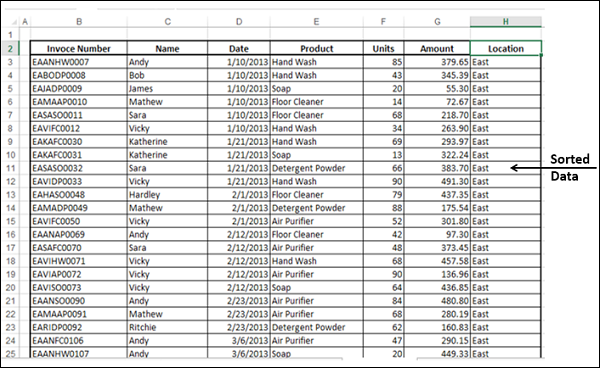
Click OK. The data is sorted location wise.
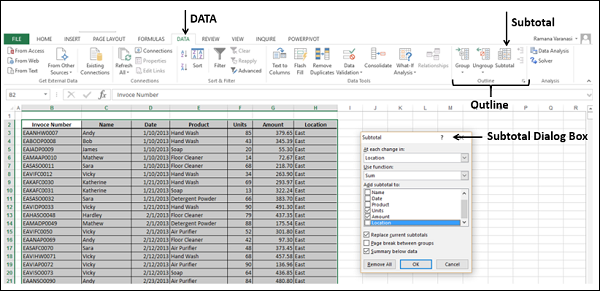
Click anywhere on the Data Range.
Click DATA tab.
Click Subtotal in the Outline group. The data gets selected and the Subtotal dialog box appears.
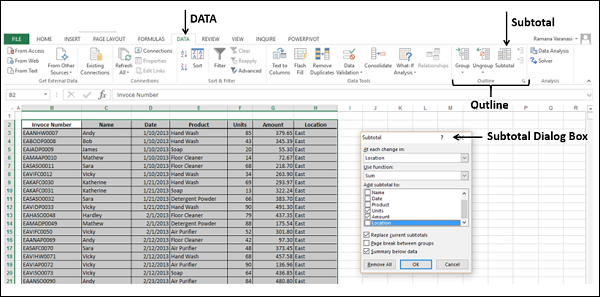
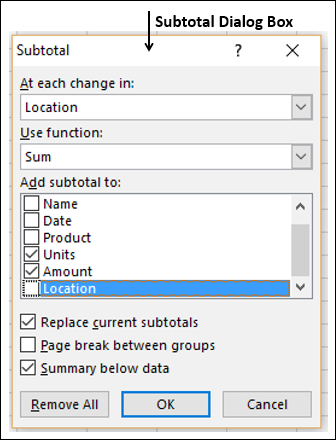
In the Subtotal dialog box,
Select Location under At each change in:
Select Sum under Use function:
Select Unit and Amount under Add subtotal to:
Select Replace current subtotals
Select Summary below data

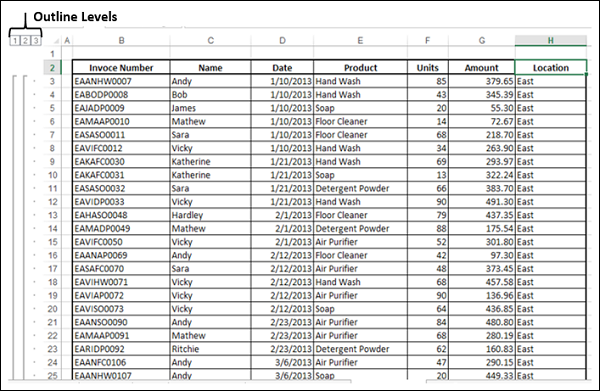
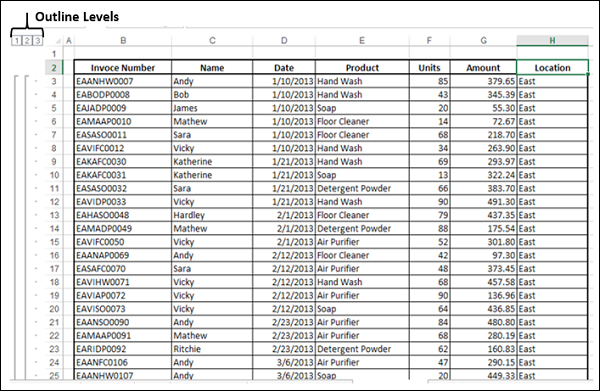
Click OK. The data is grouped with three levels and the subtotals are calculated location wise.
Note − The data that is displayed is of Level 3 i.e. entire data.
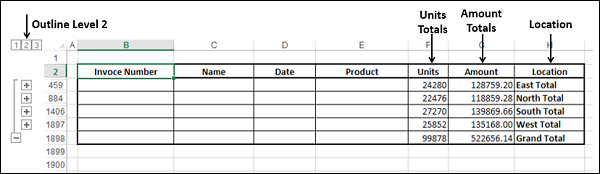
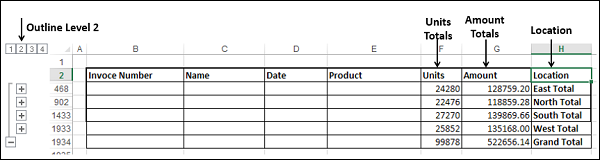
Click the Outline Level 2. The Totals will be displayed location wise for units and amount.
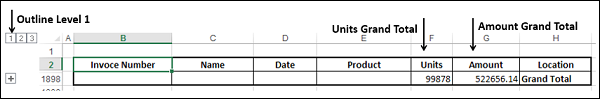
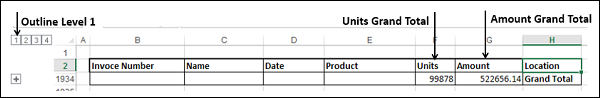
Click Outline Level 1. The Grand Totals will be displayed for units and amount.
You can zoom-in or zoom-out the data by clicking the Outline Levels or by clicking the + Symbols to the left of the data.
Nested Subtotals
You can obtain the sum of sales by each salesperson, location wise using Nested Subtotals.
Sort the data location wise and then salesperson wise.
Click anywhere on the data range.
Click the DATA tab.
Click Sort. The data is selected and the Sort dialog box appears.
In the Sort dialog box,
Select Location for Sort by
Select Values for Sort On
Select A to Z for Order
Click on Add Level
Then by row appears
Select Name for Then by
Select Values for Sort On
Select A to Z for Order
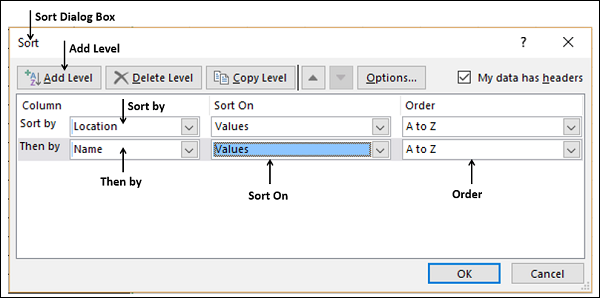
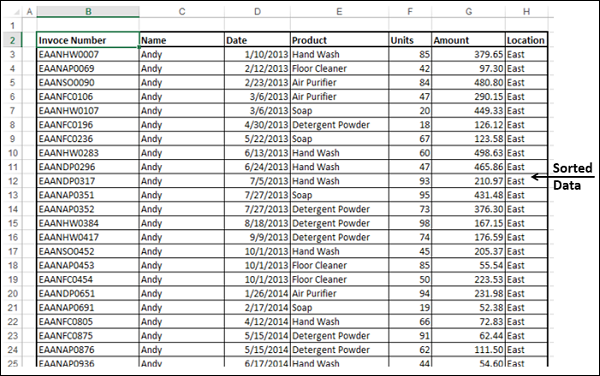
Click OK. The data is sorted by location and then by name.
Click anywhere on the Data Range
Click on DATA tab
Click on Subtotal in the Outline group
Data gets selected. Subtotal dialog box appears.
In the Subtotal dialog box,
Select Location under At each change in:
Select Sum under Use function:
Select Unit and Amount under Add subtotal to:
Select Replace current subtotals
Select Summary below data
Click OK. The data is grouped with three Levels and the subtotals are calculated location wise as described earlier.
Click Subtotal.
In the Subtotal dialog box,
Select Name under At each change in:
Select Sum under Use function:
Select Unit and Amount under Add subtotal to:
Unselect Replace current subtotals
Select Summary below data
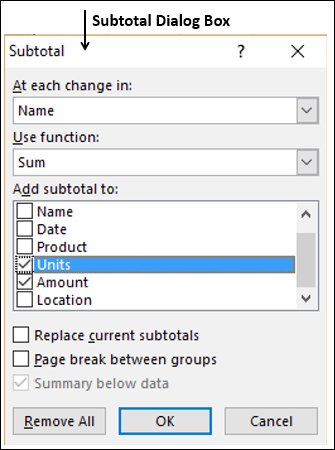
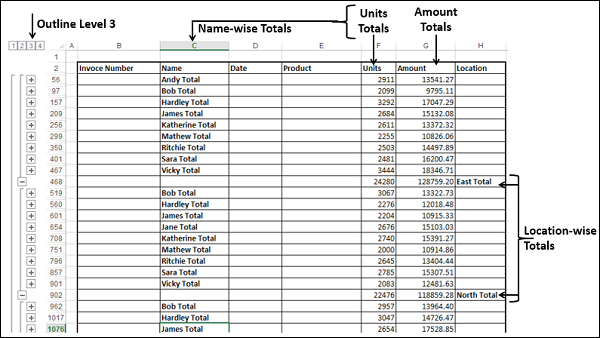
Click OK. The data is grouped with four levels and the subtotals are calculated location wise and name wise.
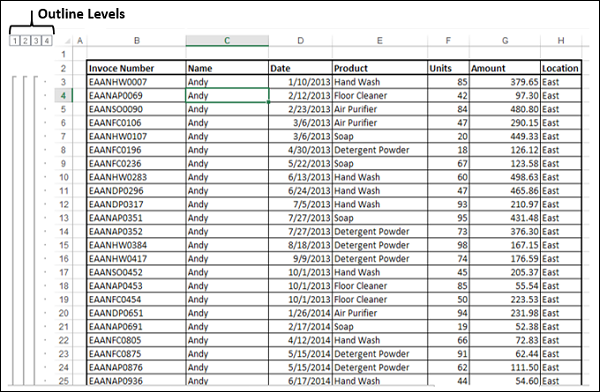
Click Outline Level 3. The Totals will be displayed name wise and location wise for Units and Amount.
Click on Outline Level 2. The Totals will be displayed location wise for Units and Amount.
Click Outline Level 1. The Grand Totals will be displayed for Units and Amount.
You can zoom-in or zoom-out the data by clicking the Outline Levels or by clicking the + symbol to the Left of the data.
