- Excel Data Analysis - Home
- Data Analysis - Overview
- Data Analysis - Process
- Excel Data Analysis - Overview
- Working with Range Names
- Tables
- Cleaning Data with Text Functions
- Cleaning Data Contains Date Values
- Working with Time Values
- Conditional Formatting
- Sorting
- Filtering
- Subtotals with Ranges
- Quick Analysis
- Lookup Functions
- PivotTables
- Data Visualization
- Data Validation
- Financial Analysis
- Working with Multiple Sheets
- Formula Auditing
- Inquire
- Advanced Data Analysis - Overview
- Data Consolidation
- What-If Analysis
- What-If Analysis with Data Tables
- What-If Analysis Scenario Manager
- What-If Analysis with Goal Seek
- Optimization with Excel Solver
- Importing Data into Excel
- Data Model
- Exploring Data with PivotTables
- Exploring Data with Powerpivot
- Exploring Data with Power View
- Exploring Data Power View Charts
- Exploring Data Power View Maps
- Exploring Data PowerView Multiples
- Exploring Data Power View Tiles
- Exploring Data with Hierarchies
- Aesthetic Power View Reports
- Key Performance Indicators
- Excel Data Analysis Resources
- Excel Data Analysis - Quick Guide
- Excel Data Analysis - Resources
- Excel Data Analysis - Discussion
Exploring Data with Powerpivot
PowerPivot is an easy to use Data Analysis tool that can be used from within Excel. You can use PowerPivot to access and mashup data from virtually any data source. You can create your own fascinating reports with PowerPivot.
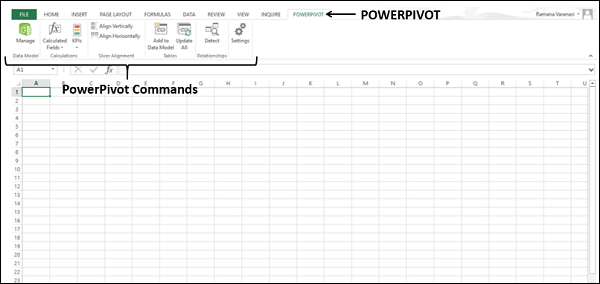
You can access the PowerPivot commands from PowerPivot tab on the Ribbon. Click the PowerPivot tab on the Ribbon. The PowerPivot commands will be displayed on the Ribbon. You can observe that the commands related to Data Model also appear here.
Adding Tables to Data Model
If you have imported tables, they are added to the Data Model. You can manage the Data Model from PowerPivot Ribbon. You can add tables to Data Model with PowerPivot as follows −
- Insert a new worksheet in your workbook.
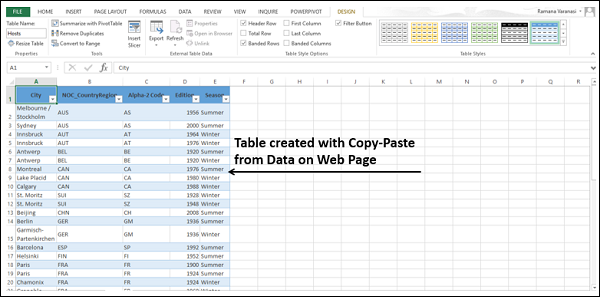
- Copy data from the web page and paste it on the worksheet.
- Create a table with the pasted data.
- Name the table as Hosts.
- Rename the worksheet as Hosts.
- Click the table Hosts.
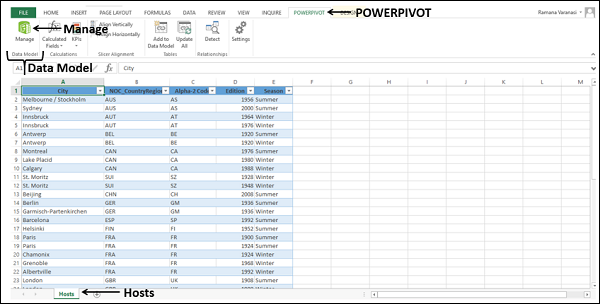
- Click the POWERPIVOT tab on the Ribbon.
- Click Add to Data Model in the Tables group.
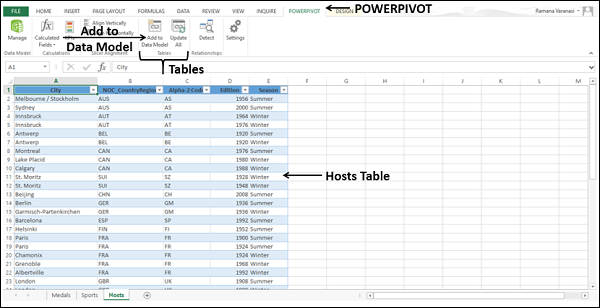
The table is added to the Data Model. The PowerPivot window appears. You will find the table Hosts in the Data Model tables.
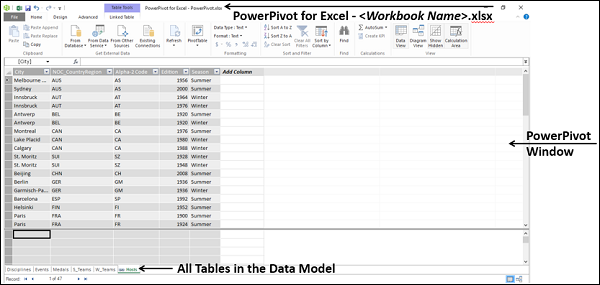
Viewing Tables in the Data Model
- Click on the POWERPIVOT tab on the Ribbon.
- Click on Manage in the Data Model group.
PowerPivot window appears, in Data View.
PowerPivot has two views −
Data View − It displays all the tables in the Data Model with fields displayed in columns and data as records in the rows, with a calculation area below each table. The table tabs look similar to the Excel worksheet tabs with names. You can move from table to table by clicking on the tabs.
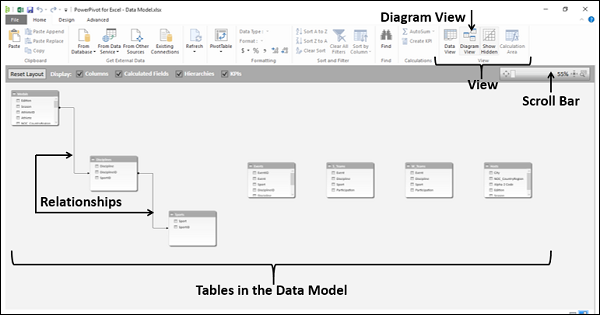
Diagram View − It displays all the tables as boxes with table name as caption and the fields listed in the box. You can drag the tables to align them, resize them to make all the fields visible, and create relationships by just clicking on the fields and connecting them with lines.
You will understand the Diagram View and the Relationships in detail in the later sections.
Here, observe that all the tables in the Data Model are visible in the PowerPivot window, irrespective of whether they are present as worksheets in the workbook or not.
Viewing Relationships between Tables
You can use the data from different tables for analysis and reporting only when relationships exist among them.
You can view the relationships between tables from the diagram view in the PowerPivot window.
Click Diagram View in the View group.
Resize the diagram using the scroll bar so that you can see all the tables in the Data Model in the diagram.
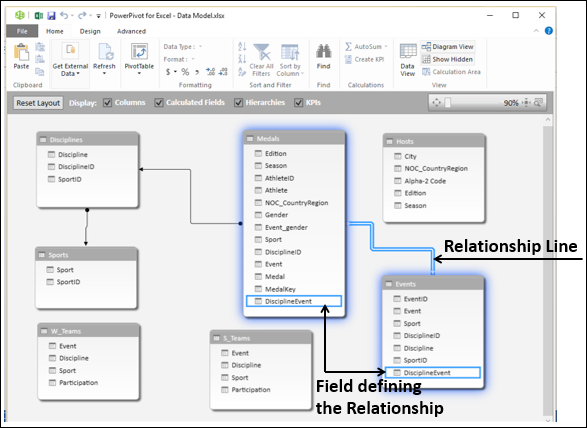
All the tables in the Data Model appear with their fields lists. The relationships among the tables are denoted by the lines connecting them.
Creating Relationships between Tables
You might want to create a relationship between the tables Medals and Events. In order to do this, there should be a field that is common in both the tables and contains unique values in one of the tables. First, you need to verify this.
- Click the Data View in the View group.
- Click the Events tab to view the Events table.
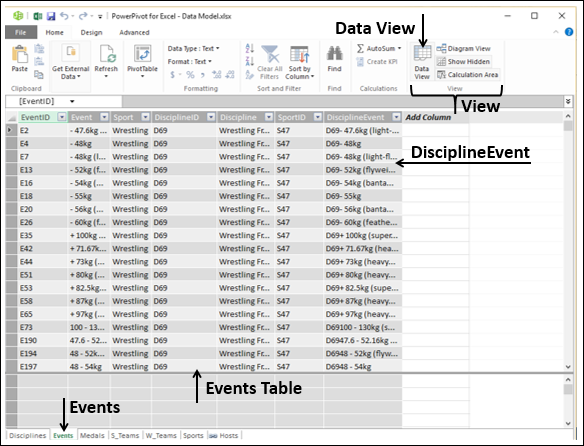
You can observe that the field DisciplineEvent in the Events table has unique values (no duplicate values).
Click the Medals tab to view the Medals table. The field DisciplineEvent is available in the Medals table also. Hence, you can create a relationship using the field DisciplineEvent as follows −
Click Diagram View in the View group.
Rearrange the tables in the view by dragging them so that Events table and Medals table are close to each other.
Resize the tables so that all the fields are visible.
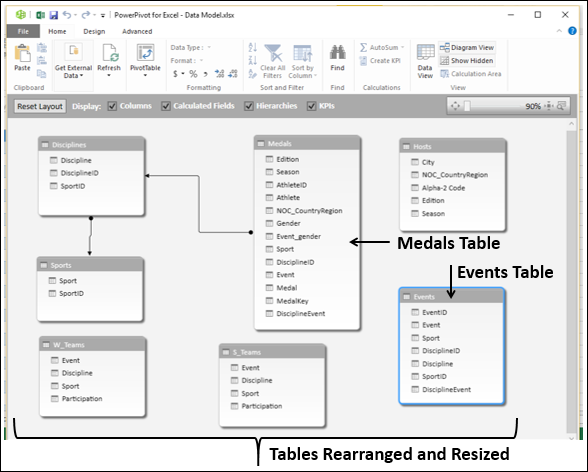
Click the field DisciplineEvent in the Events table and Drag to the field DisciplineEvent in the Medals table.
A line appears between the Events table and the Medals table, indicating that a relationship has been established.
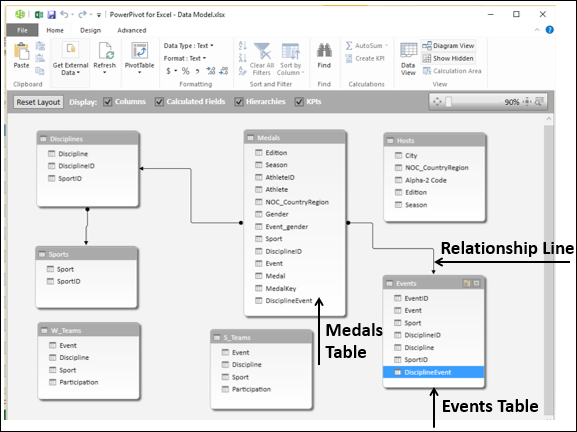
Viewing the Field defining a Relationship
You can view the field that is used to create the relationship between two tables.
Click the relationship line connecting the two tables. The relationship line and the field defining the relationship between the two tables get highlighted.