- Excel Data Analysis - Home
- Data Analysis - Overview
- Data Analysis - Process
- Excel Data Analysis - Overview
- Working with Range Names
- Tables
- Cleaning Data with Text Functions
- Cleaning Data Contains Date Values
- Working with Time Values
- Conditional Formatting
- Sorting
- Filtering
- Subtotals with Ranges
- Quick Analysis
- Lookup Functions
- PivotTables
- Data Visualization
- Data Validation
- Financial Analysis
- Working with Multiple Sheets
- Formula Auditing
- Inquire
- Advanced Data Analysis - Overview
- Data Consolidation
- What-If Analysis
- What-If Analysis with Data Tables
- What-If Analysis Scenario Manager
- What-If Analysis with Goal Seek
- Optimization with Excel Solver
- Importing Data into Excel
- Data Model
- Exploring Data with PivotTables
- Exploring Data with Powerpivot
- Exploring Data with Power View
- Exploring Data Power View Charts
- Exploring Data Power View Maps
- Exploring Data PowerView Multiples
- Exploring Data Power View Tiles
- Exploring Data with Hierarchies
- Aesthetic Power View Reports
- Key Performance Indicators
- Excel Data Analysis Resources
- Excel Data Analysis - Quick Guide
- Excel Data Analysis - Resources
- Excel Data Analysis - Discussion
Excel Data Financial Analysis
You can perform financial analysis with Excel in an easy way. Excel provides you several financial functions such as PMT, PV, NPV, XNPV, IRR, MIRR, XIRR, and so on that enable you to quickly arrive at the financial analysis results.
In this chapter, you will learn where and how you can use these functions for your analysis.
What is Annuity?
An annuity is a series of constant cash payments made over a continuous period. For example, savings for retirement, insurance payments, home loan, mortgage, etc. In annuity functions −
- A positive number represents cash received.
- A negative number represents cash paid out.
Present Value of a series of Future Payments
The present value is the total amount that a series of future payments is worth now. You can calculate the present value using the Excel functions −
PV − Calculates the present value of an investment by using an interest rate and a series of future payments (negative values) and income (positive values). At least one of the cash flows must be positive and at least one must be negative.
NPV − Calculates the net present value of an investment by using a discount rate and a series of periodic future payments (negative values) and income (positive values).
XNPV − Calculates the net present value for a schedule of cash flows that is not necessarily periodic.
Note that −
PV cash flows must be constant whereas NPV cash flows can be variable.
PV cash flows can be either at the beginning or at the end of the period whereas NPV cash flows must be at the end of the period.
NPV cash flows must be periodic whereas XNPV cash flows need not be periodic.
In this section, you will understand how to work with PV. You will learn about NPV in a later section.
Example
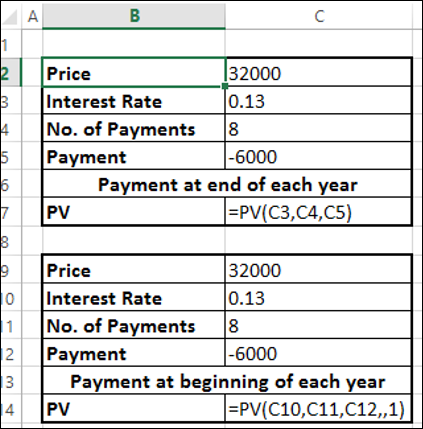
Suppose you are buying a refrigerator. The salesperson tells you that the price of the refrigerator is 32000, but you have an option to pay out the amount in 8 years with an interest rate of 13% per annum and yearly payments of 6000. You also have an option to make the payments either at the beginning or end of each year.
You want to know which of these options is beneficial for you.
You can use Excel function PV −
PV (rate, nper, pmt, [fv ], [type])
To calculate present value with payments at the end of each year, omit type or specify 0 for type.
To calculate present value with payments at the end of each year, specify 1 for type.
You will get the following results −
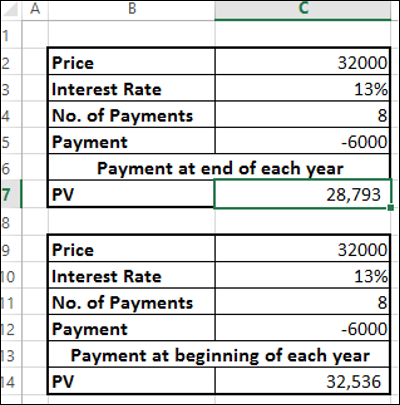
Therefore,
- If you make the payment now, you need to pay 32,000 of present value.
- If you opt for yearly payments with payment at the end of the year, you need to pay 28, 793 of present value.
- If you opt for yearly payments with payment at the end of the year, you need to pay 32,536 of present value.
You can clearly see that option 2 is beneficial for you.
What is EMI?
An Equated Monthly Installment (EMI) is defined by Investopedia as "A fixed payment amount made by a borrower to a lender at a specified date each calendar month. Equated monthly installments are used to pay off both interest and principal each month, so that over a specified number of years, the loan is paid off in full."
EMI on a Loan
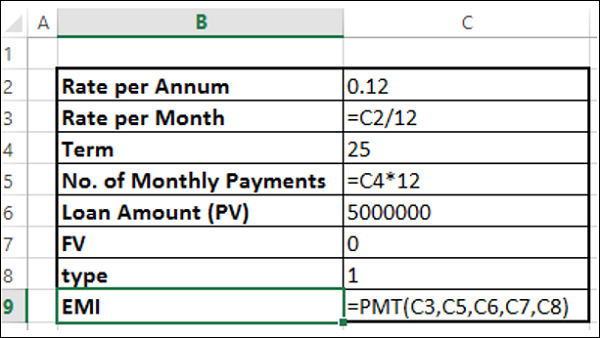
In Excel, you can calculate the EMI on a loan with the PMT function.
Suppose, you want to take a home loan of 5000000 with an annual interest rate of 11.5% and the term of the loan for 25 years. You can find your EMI as follows −
- Calculate interest rate per month (Interest Rate per Annum/12)
- Calculate number of monthly payments (No. of years * 12)
- Use PMT function to calculate EMI
As you observe,
- Present Value (PV) is the loan amount.
- Future Value (FV) is 0 as at the end of the term the loan amount should be 0.
- Type is 1 as the EMIs are paid at the beginning of each month.
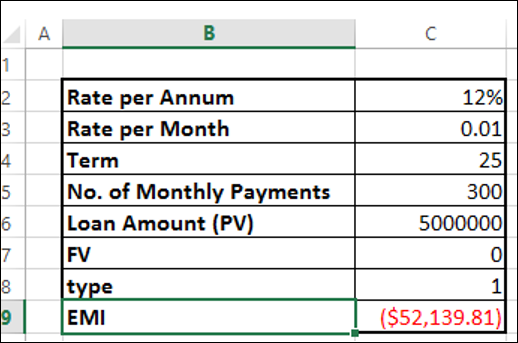
You will get the following results −
Monthly Payment of Principal and Interest on a Loan
EMI includes both-interest and a part payment of principal. As the time increases, these two components of EMI will vary, reducing the balance.
To get
The interest part of your monthly payments, you can use the Excel IPMT function.
The payment of principal part of your monthly payments, you can use the Excel PPMT function.
For example, if you have taken a loan of 1,000,000 for a term of 8 months at the rate of 16% per annum. You can get values for the EMI, the decreasing interest amounts, the increasing payment of principal amounts and the diminishing loan balance over the 8 months. At the end of 8 months, loan balance will be 0.
Follow the procedure given below.
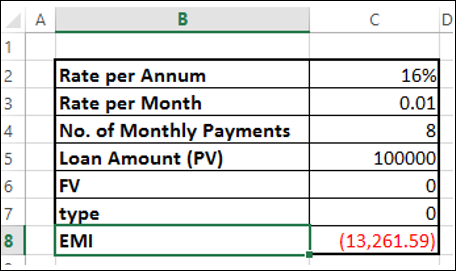
Step 1 − Calculate the EMI as follows.
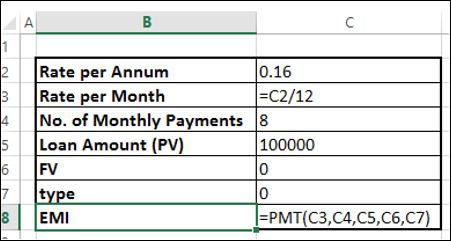
This results in an EMI of Rs. 13261.59.
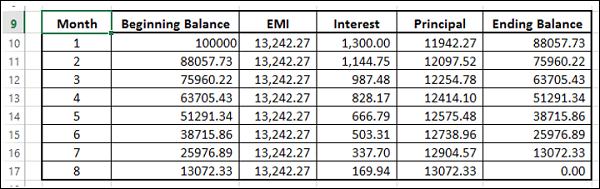
Step 2 − Next calculate the interest and principal parts of the EMI for the 8 months as shown below.
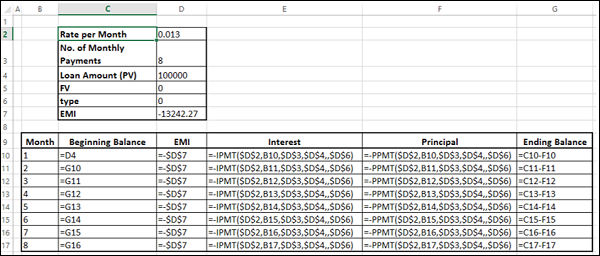
You will get the following results.
Interest and Principal paid between two Periods
You can compute the interest and principal paid between two periods, inclusive.
Compute the cumulative interest paid between 2nd and 3rd months using the CUMIPMT function.
Verify the result summing up the interest values for 2nd and 3rd months.
Compute the cumulative principal paid between 2nd and 3rd months using the CUMPRINC function.
Verify the result summing up the principal values for 2nd and 3rd months.
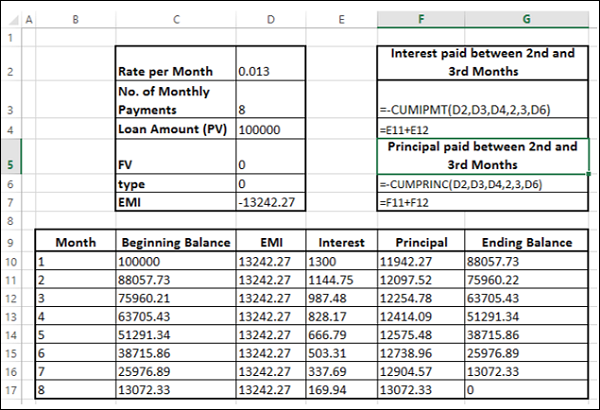
You will get the following results.
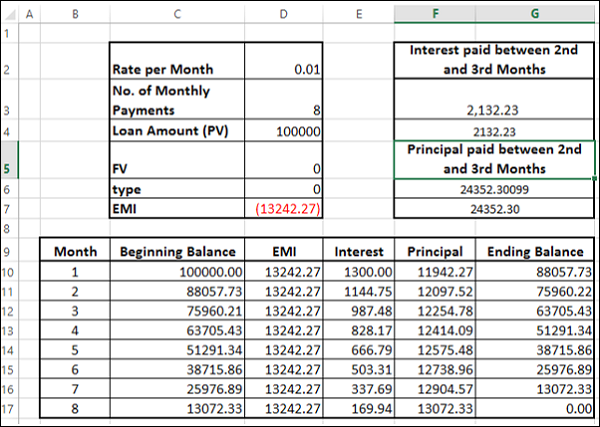
You can see that your calculations match with your verification results.
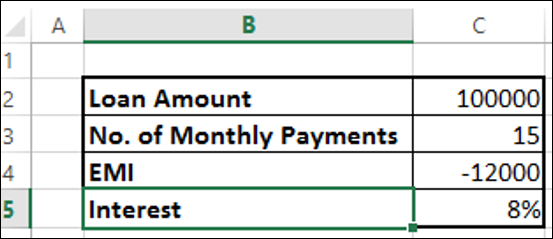
Calculating Interest Rate
Suppose you take a loan of 100,000 and you want to pay back in 15 months with a maximum monthly payment of 12000. You might want to know the interest rate at which you have to pay.
Find the interest rate with the Excel RATE function −
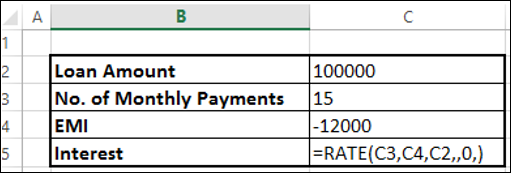
You will get the result as 8%.
Calculating Term of Loan
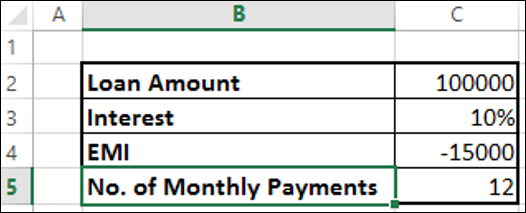
Suppose you take a loan of 100,000 at the interest rate 10%. You want a maximum monthly payment of 15,000. You might want to know how long it will take for you to clear the loan.
Find the number of payments with Excel NPER function
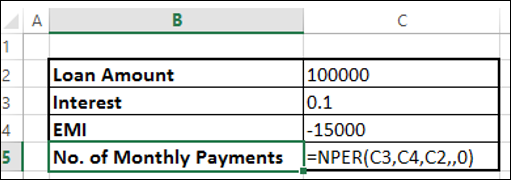
You will get the result as 12 months.
Decisions on Investments
When you want to make an investment, you compare the different options and choose the one that yields better returns. Net present value is useful in comparing cash flows over a period of time and deciding which one is better. The cash flows can occur at regular, periodical intervals or at irregular intervals.
First, we consider the case of regular, periodical cash flows.
The net present value of a sequence of cash flows received at different points in time in n years from now (n can be a fraction) is 1/(1 + r)n, where r is the annual interest rate.
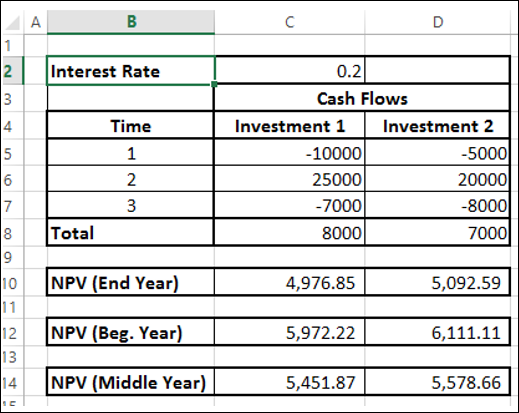
Consider the following two investments over a period of 3 years.
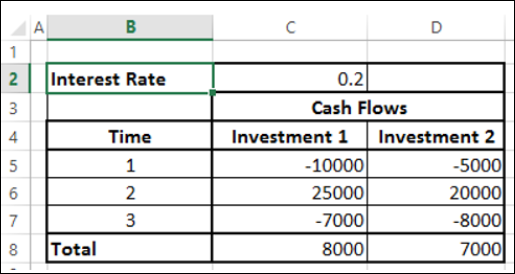
At face value, Investment 1 looks better than Investment 2. However, you can decide on which investment is better only when you know the true worth of the investment as of today. You can use the NPV function to calculate the returns.
The cash flows can occur
- At the end of every year.
- At the beginning of every year.
- In the middle of every year.
NPV function assumes that the cash flows are at the end of the year. If the cash flows occur at different times then you have to take into account that particular factor along with the calculation with NPV.
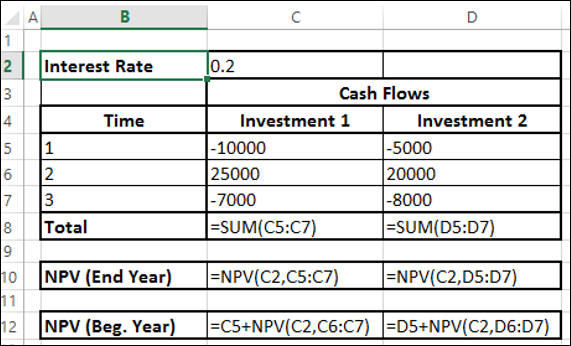
Suppose the cash flows occur at the end of the year. Then you can straight away use the NPV function.
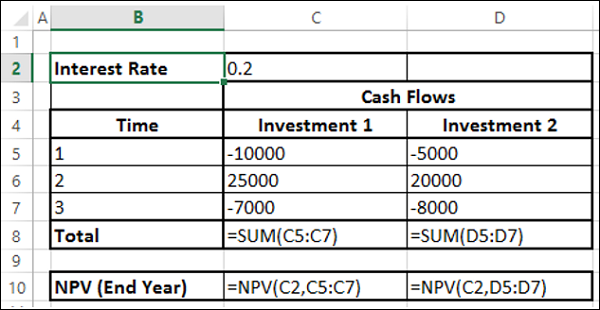
You will get the following results −
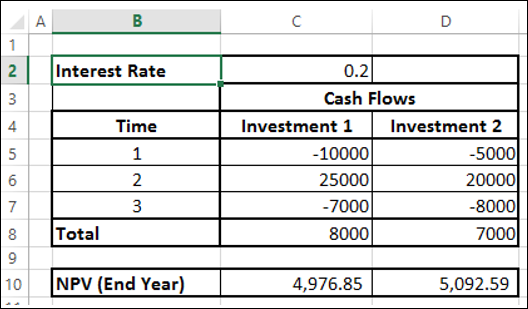
As you observe NPV for Investment 2 is higher than that for Investment 1. Hence, Investment 2 is a better choice. You got this result as cash out flows for Investment 2 are at later periods as compared to that of Investment 1.
Cash Flows at the Beginning of the Year
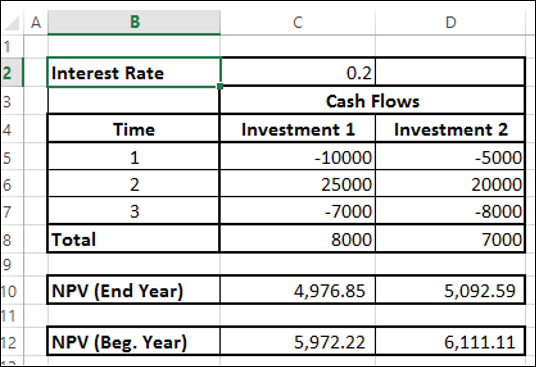
Suppose the cash flows occur at the beginning of every year. In such a case, you should not include the first cash flow in NPV calculation as it already represents the current value. You need to add the first cash flow to the NPV obtained from rest of the cash flows to get the net present value.
You will get the following results −
Cash Flows in the Middle of the Year
Suppose the cash flows occur in the middle of every year. In such a case, you need to multiply the NPV obtained from the cash flows by $\sqrt{1+r}$ to get the net present value.
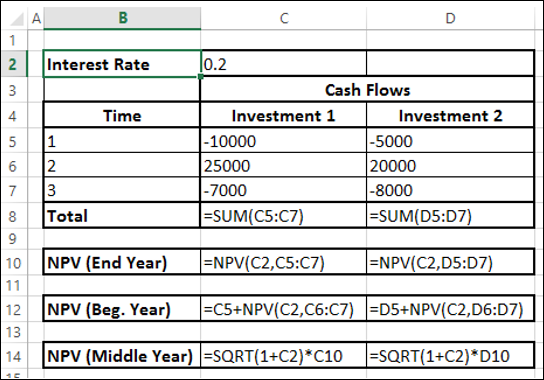
You will get the following results −
Cash Flows at Irregular Intervals
If you want to calculate the net present value with irregular cash flows, i.e. cash flows occurring at random times, the calculation is a bit complex.
However, in Excel, you can easily do such a calculation with XNPV function.
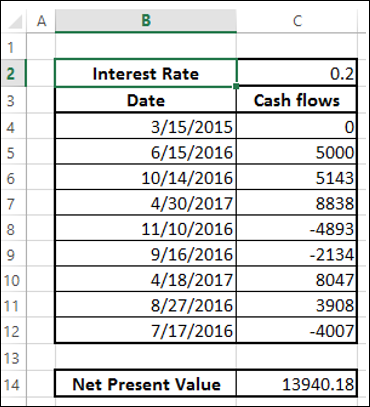
- Arrange your data with the dates and the cash flows.
Note − The first date in your data should be the earliest of all the dates. The other dates can occur in any order.
- Use the XNPV function to calculate the net present value.
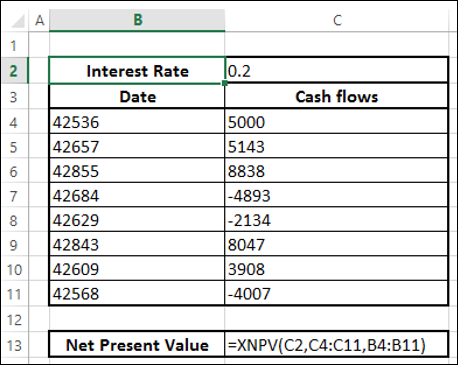
You will get the following results −
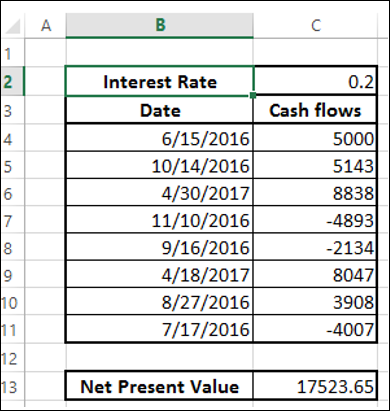
Suppose todays date is 15th March, 2015. As you observe, all the dates of cash flows are of later dates. If you want to find the net present value as of today, include it in the data at the top and specify 0 for the cash flow.
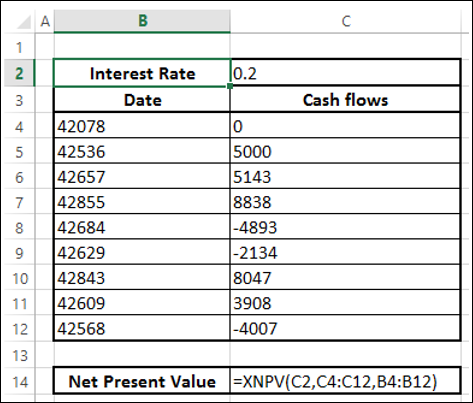
You will get the following results −
Internal Rate of Return (IRR)
Internal Rate of Return (IRR) of an investment is the rate of interest at which NPV is 0. It is the rate value for which the present values of the positive cash flows exactly compensate the negative ones. When the discount rate is the IRR, the investment is perfectly indifferent, i.e. the investor is neither gaining nor losing money.
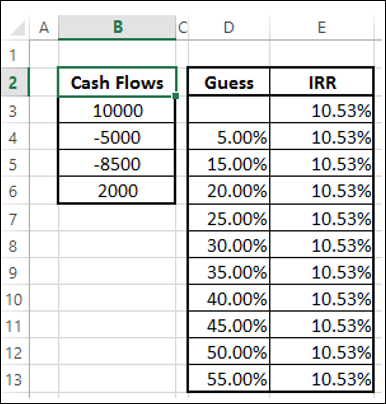
Consider the following cash flows, different interest rates and the corresponding NPV values.
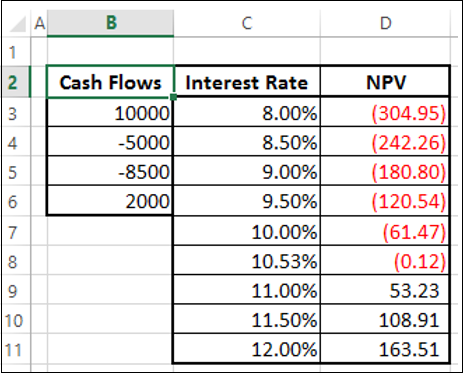
As you can observe between the values of interest rate 10% and 11%, the sign of NPV changes. When you fine-tune the interest rate to 10.53%, NPV is nearly 0. Hence, IRR is 10.53%.
Determining IRR of Cash Flows for a Project
You can calculate IRR of cash flows with Excel function IRR.
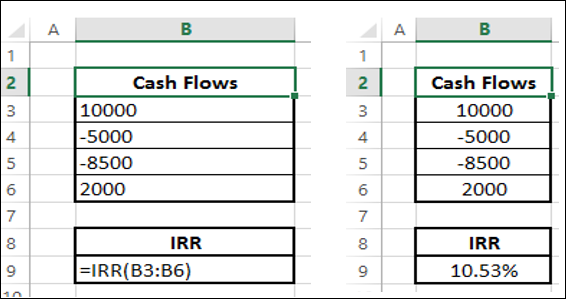
The IRR is 10.53% as you had seen in the previous section.
For the given cash flows, IRR may −
- exist and unique
- exist and multiple
- not exist
Unique IRR
If IRR exists and is unique, it can be used to choose the best investment among several possibilities.
If the first cash flow is negative, it means the investor has the money and wants to invest. Then, the higher the IRR the better, since it represents the interest rate the investor is receiving.
If the first cash flow is positive, it means the investor needs money and is looking for a loan, the lower the IRR the better since it represents the interest rate the investor is paying.
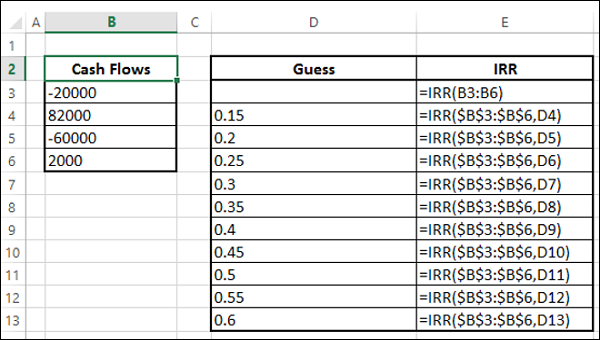
To find if an IRR is unique or not, vary the guess value and calculate IRR. If IRR remains constant then it is unique.
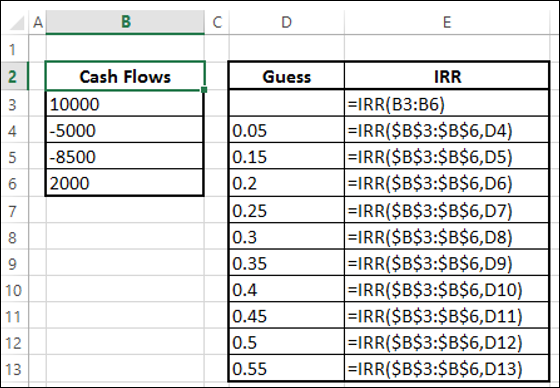
As you observe, the IRR has a unique value for the different guess values.
Multiple IRRs
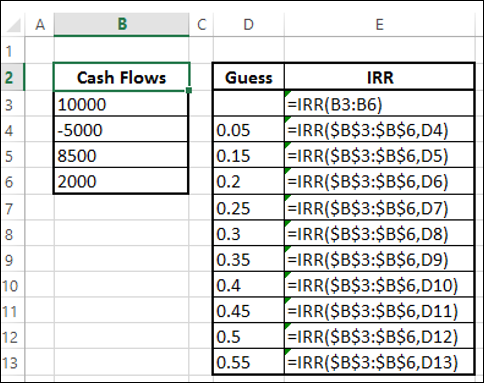
In certain cases, you may have multiple IRRs. Consider the following cash flows. Calculate IRR with different guess values.
You will get the following results −
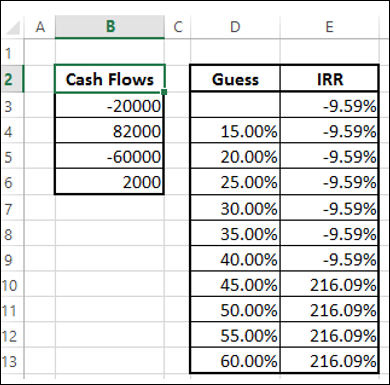
You can observe that there are two IRRs - -9.59% and 216.09%. You can verify these two IRRs calculating NPV.
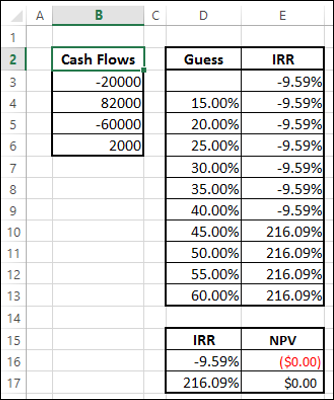
For both -9.59% and 216.09%, NPV is 0.
No IRRs
In certain cases, you may not have IRR. Consider the following cash flows. Calculate IRR with different guess values.
You will get the result as #NUM for all the guess values.
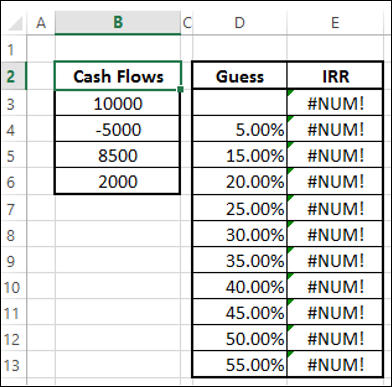
The result #NUM means that there is no IRR for the cash flows considered.
Cash Flows Patterns and IRR
If there is only one sign change in the cash flows, such as from negative to positive or positive to negative, then a unique IRR is guaranteed. For example, in capital investments, the first cash flow will be negative, while the rest of the cash flows will be positive. In such cases, unique IRR exists.
If there is more than one sign change in the cash flows, IRR may not exist. Even if it exists, it may not be unique.
Decisions based on IRRs
Many analysts prefer to use IRR and it is a popular profitability measure because, as a percentage, it is easy to understand and easy to compare to the required return. However, there are certain problems while making decisions with IRR. If you rank with IRRs and make decisions based on these ranks, you may end up with wrong decisions.
You have already seen that NPV will enable you to make financial decisions. However, IRR and NPV will not always lead to the same decision when projects are mutually exclusive.
Mutually exclusive projects are those for which the selection of one project precludes the acceptance of another. When projects that are being compared are mutually exclusive, a ranking conflict may arise between NPV and IRR. If you have to choose between project A and project B, NPV may suggest acceptance of project A whereas IRR may suggest project B.
This type of conflict between NPV and IRR may arise because of one of the following reasons −
- The projects are of greatly different sizes, or
- The timing of the cash flows are different.
Projects of significant size difference
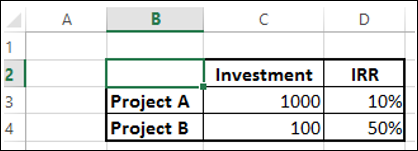
If you want to make a decision by IRR, project A yields a return of 100 and Project B a return of 50. Hence, investment on project A looks profitable. However, this is a wrong decision because of the difference in the scale of projects.
Consider −
You have 1000 to invest.
If you invest entire 1000 on project A, you get a return of 100.
If you invest 100 on project B, you will still have 900 in your hand that you can invest on another project, say project C. Suppose you get a return of 20% on project C, then the total return on project B and project C is 230, which is way ahead in profitability.
Thus, NPV is a better way for decision making in such cases.
Projects with different cash flows timings
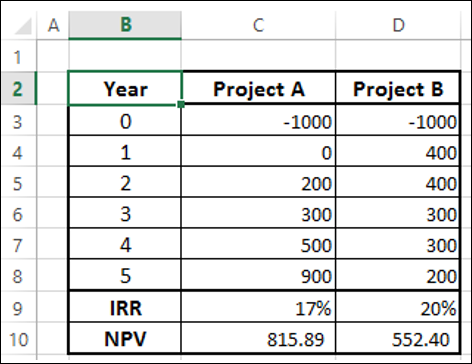
Again, if you consider IRR to decide, project B would be the choice. However, project A has a higher NPV and is an ideal choice.
IRR of Irregularly Spaced Cash Flows (XIRR)
Your cash flows may sometimes be irregularly spaced. In such a case, you cannot use IRR as IRR requires equally spaced time intervals. You can use XIRR instead, which takes into account the dates of the cash flows along with the cash flows.
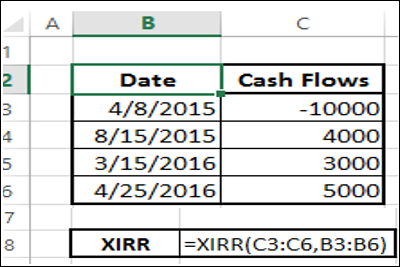
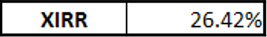
The Internal Rate of Return that results in is 26.42%.
Modified IRR (MIRR)
Consider a case when your finance rate is different from your reinvestment rate. If you calculate Internal Rate of Return with IRR, it assumes same rate for both finance and reinvestment. Further, you might also get multiple IRRs.
For example, consider the cash flows given below −
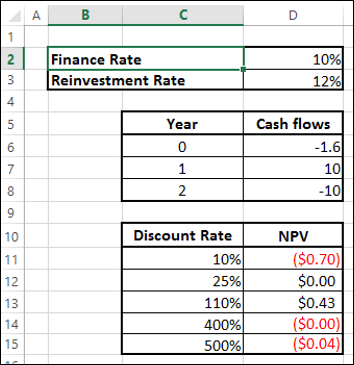
As you observe, NPV is 0 more than once, resulting in multiple IRRs. Further, reinvestment rate is not taken into account. In such cases, you can use modified IRR (MIRR).
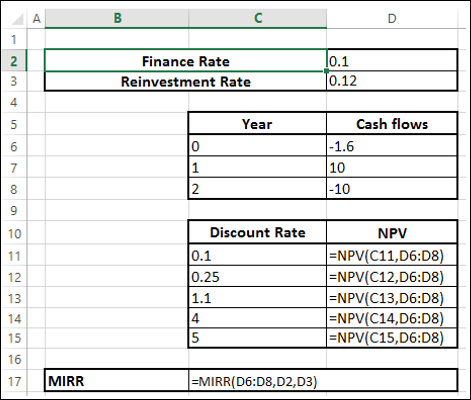
You will get a result of 7% as shown below −
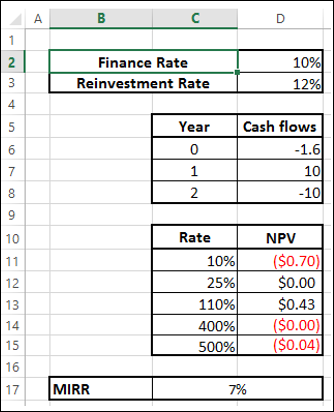
Note − Unlike IRR, MIRR will always be unique.
