- Excel Data Analysis - Home
- Data Analysis - Overview
- Data Analysis - Process
- Excel Data Analysis - Overview
- Working with Range Names
- Tables
- Cleaning Data with Text Functions
- Cleaning Data Contains Date Values
- Working with Time Values
- Conditional Formatting
- Sorting
- Filtering
- Subtotals with Ranges
- Quick Analysis
- Lookup Functions
- PivotTables
- Data Visualization
- Data Validation
- Financial Analysis
- Working with Multiple Sheets
- Formula Auditing
- Inquire
- Advanced Data Analysis - Overview
- Data Consolidation
- What-If Analysis
- What-If Analysis with Data Tables
- What-If Analysis Scenario Manager
- What-If Analysis with Goal Seek
- Optimization with Excel Solver
- Importing Data into Excel
- Data Model
- Exploring Data with PivotTables
- Exploring Data with Powerpivot
- Exploring Data with Power View
- Exploring Data Power View Charts
- Exploring Data Power View Maps
- Exploring Data PowerView Multiples
- Exploring Data Power View Tiles
- Exploring Data with Hierarchies
- Aesthetic Power View Reports
- Key Performance Indicators
- Excel Data Analysis Resources
- Excel Data Analysis - Quick Guide
- Excel Data Analysis - Resources
- Excel Data Analysis - Discussion
Advanced Data Analysis - Data Model
Data Model is available in Excel 2013 and later versions. In Excel, you can use the Data Model to integrate data from multiple tables in the current workbook and / or from the imported data and / or from the data sources connected to the workbook through data connections.
With a Data Model, you can create relationships among the tables. Data model is used transparently in PivotTable, PivotChart, PowerPivot and Power View reports.
Creating Data Model while Importing Data
When you import data from relational databases like Microsoft Access database that contain multiple related tables, Data Model is automatically created if you import more than one table at once.
You can optionally add tables to the Data Model, when you import data from the following data sources −
- Relational databases, one table at a time
- Text Files
- Excel Workbooks
For example, while you are importing data from an Excel workbook, you can observe the option Add this data to the Data Model, with an enabled check box.
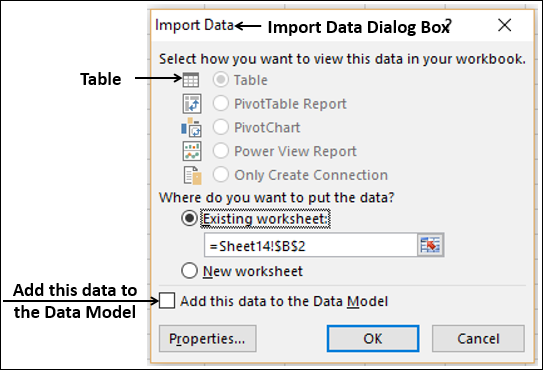
If you want to add the data you are importing to the Data Model, check the box.
Creating Data Model from Excel Tables
You can create the Data Model from Excel tables using PowerPivot commands. You will learn PowerPivot in detail in later chapters.
All the Data Model commands are available under the PowerPivot tab on the Ribbon. You can add Excel tables to the Data Model with these commands.
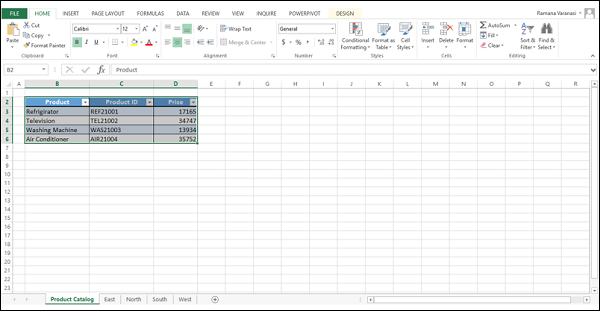
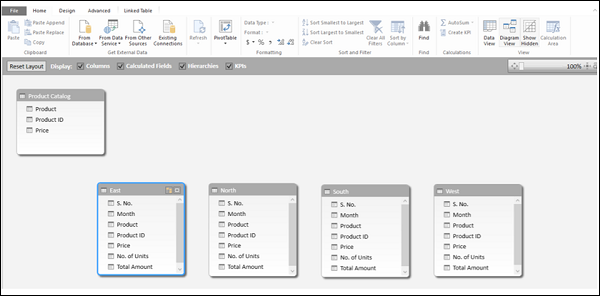
Consider the following sales data workbook, wherein you have Product Catalog worksheet that contains Product, Product ID and Price. You have four worksheets for the sales in 4 regions East, North, South and West.
Each of these four worksheets contain No. of Units sold and Total Amount for each of the Products in each month. You need to calculate the total amount for each of the products in each region and total amount of sales in each region.
The following steps enable you to arrive at the desired results −
- Start with creating the Data Model.
- Click in the Product Catalog worksheet.
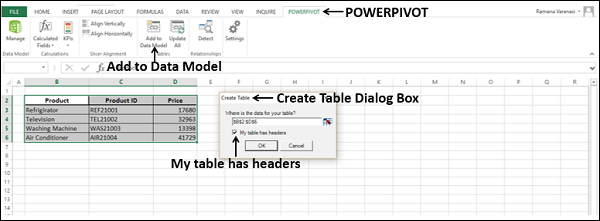
- Click the POWERPIVOT tab on the Ribbon.
- Click Add to Data Model. The Create Table dialog box appears.
- Select the table range.
- Check the box My table has headers. Click OK.
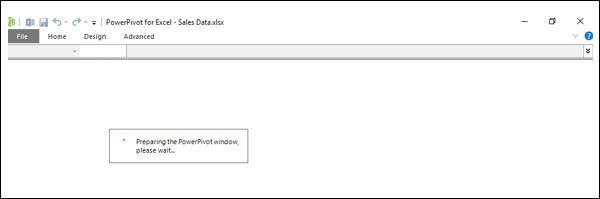
A new window PowerPivot for Excel - <your Excel file name> appears.
The following message appears in the center of the blank window −
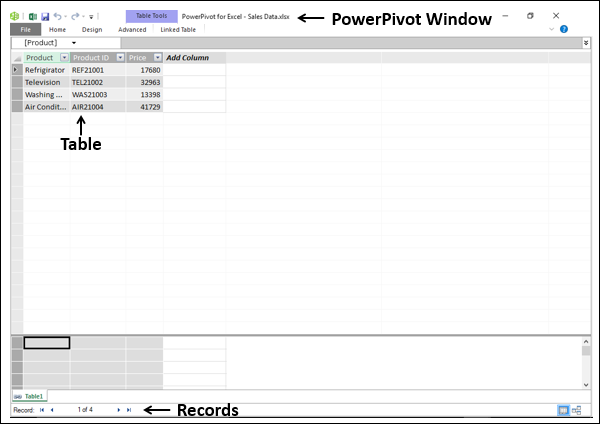
The table Product Backlog that you added to the Data Model appears as a sheet in PowerPivot window. Each row in the table is a record and you can go back and forth the records using the left and right arrow buttons at the bottom of the window.

- Click the Linked Table tab in the PowerPivot window.
- Click Go to Excel Table.
The Excel data window appears.
- Click the worksheet tab East.
- Click the POWERPIVOT tab on the Ribbon.
- Click Add to Data Model.
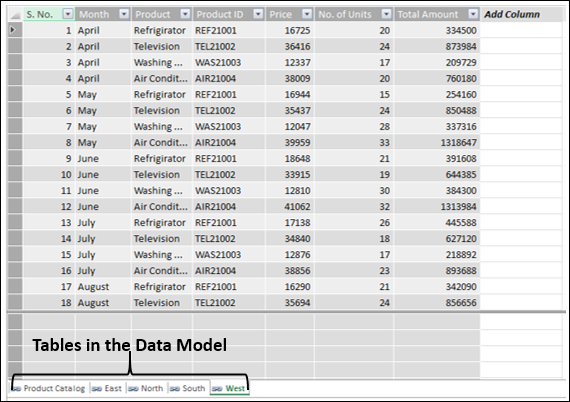
Another sheet appears in the PowerPivot window displaying the East table.
Repeat for the worksheets North, South and West. In all, you have added five tables to the Data Model. Your PowerPivot window looks as below −
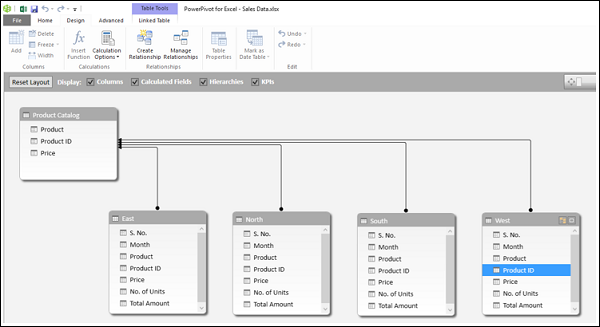
Creating Relationships between Tables
If you want to make calculations across the tables, you have to first define relationships among them.
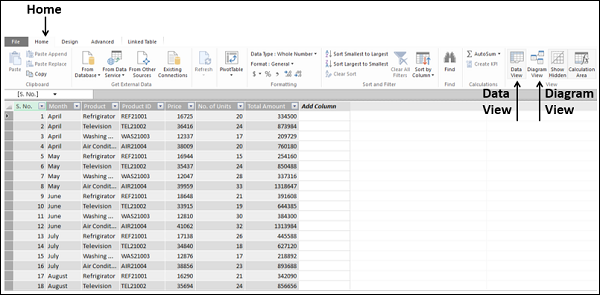
Click the Home tab on the Ribbon in the PowerPivot window. As you can observe, the tables are displayed in the Data View.
Click Diagram View.
The tables appear in the Diagram View. As you observe, some of the tables may be out of display area and all the fields in the tables may not be visible.
- Resize each table to show all the fields in that table.
- Drag and arrange the tables so that all are displayed.
- In the East table, click on Product ID.
- Click the Design tab on the Ribbon.
- Click Create Relationship. The Create Relationship dialog box appears.
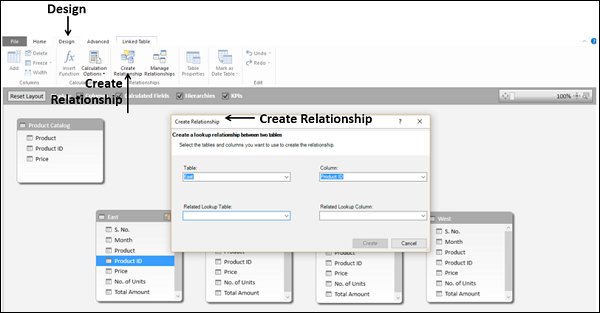
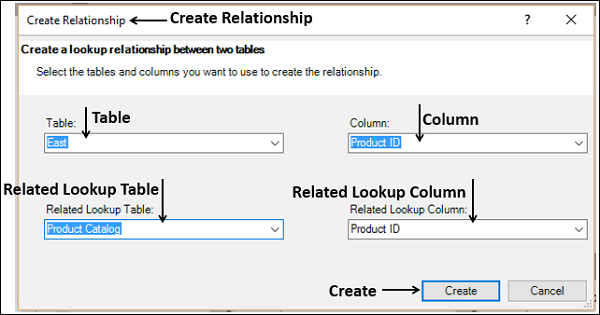
In the box under Table, East is displayed. In the box under Column, Product ID is displayed.
- In the box under Related Lookup Table, select Product Catalog.
- Product ID appears in the box under Related Lookup Column.
- Click the Create button.
Line representing Relationship between the tables East and Product Backlog appears.
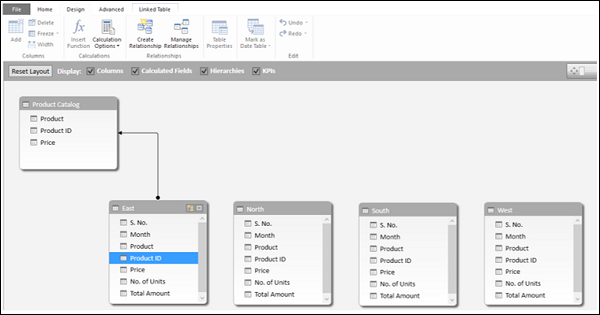
- Repeat the same steps for the tables North, South and West. Relationship Lines appear.
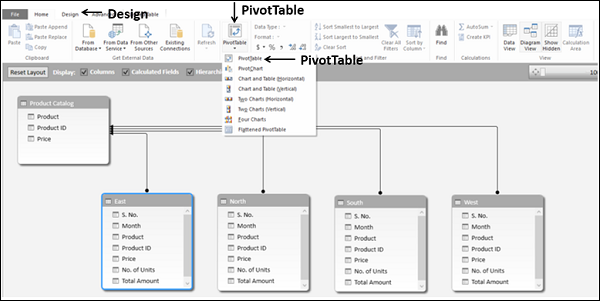
Summarizing the Data in the Tables in the Data Model
Now, you are all set to summarize the sales data for each of the products in each region in just few steps.
- Click the Home tab.
- Click PivotTable.
- Select PivotTable from the drop-down list.
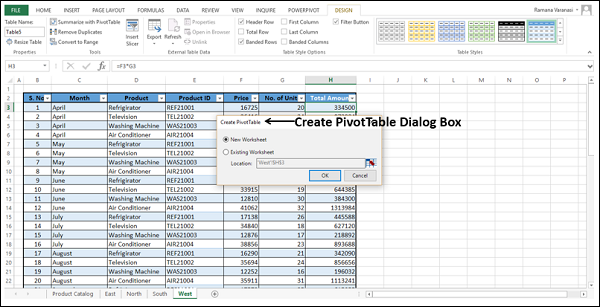
Create PivotTable dialog box appears in the Excel tables window. Select New Worksheet.
In a new worksheet, an empty PivotTable appears. As you can observe, the Fields List contains all the tables in the Data Model with all the fields displayed.
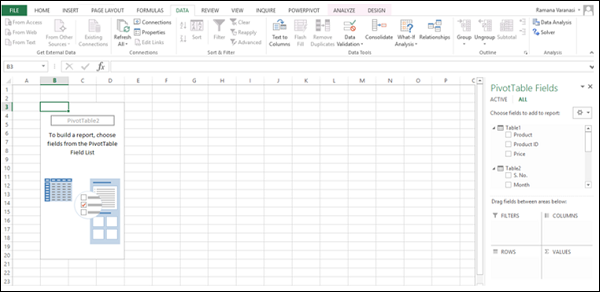
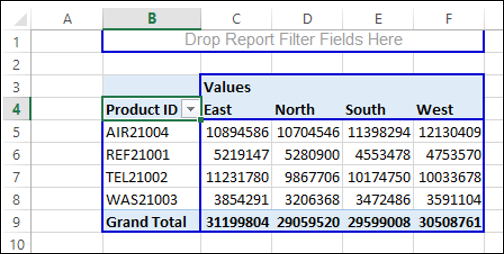
Select Product ID from Table 1 (Product Catalog).
Select Total Amount from the other four tables.
For each of fields in ∑ Values, change the Custom Name in Value Field Settings to display the region names as column labels.
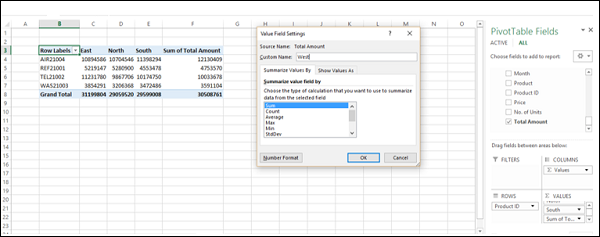
The sum of Total Amount will be replaced by the label you give. PivotTable with summarized values from all the data tables shows you the required results.
Adding Data to Data Model
You can add a new data table to the Data Model or new rows of data to the existing tables in the Data Model.
Add a new data table to the Data Model with the following steps.
Click the DATA tab on the Ribbon.
Click Existing Connections in the Get External Data group. The Existing Connections dialog box appears.
Click the Tables tab. The names of all the tables in the workbook will be displayed.
Click the name of the table you want to add to the Data Model.
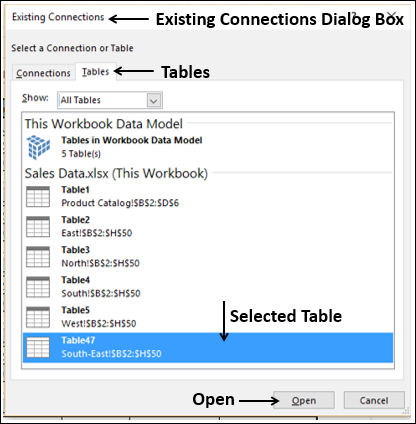
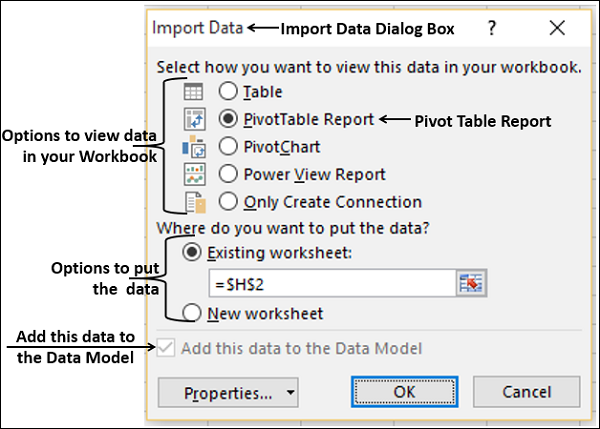
Click on the Open button. The Import Data dialog box appears.
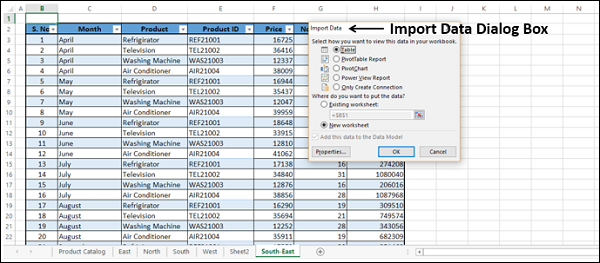
As you are aware, while importing data table, it is automatically added to the Data Model. The newly added table appears in the PowerPivot window.
Add new rows of data to the existing tables in the Data Model.
Refresh the Data Connection. New rows of data from the data source get added to the Data Model.
