- Excel Data Analysis - Home
- Data Analysis - Overview
- Data Analysis - Process
- Excel Data Analysis - Overview
- Working with Range Names
- Tables
- Cleaning Data with Text Functions
- Cleaning Data Contains Date Values
- Working with Time Values
- Conditional Formatting
- Sorting
- Filtering
- Subtotals with Ranges
- Quick Analysis
- Lookup Functions
- PivotTables
- Data Visualization
- Data Validation
- Financial Analysis
- Working with Multiple Sheets
- Formula Auditing
- Inquire
- Advanced Data Analysis - Overview
- Data Consolidation
- What-If Analysis
- What-If Analysis with Data Tables
- What-If Analysis Scenario Manager
- What-If Analysis with Goal Seek
- Optimization with Excel Solver
- Importing Data into Excel
- Data Model
- Exploring Data with PivotTables
- Exploring Data with Powerpivot
- Exploring Data with Power View
- Exploring Data Power View Charts
- Exploring Data Power View Maps
- Exploring Data PowerView Multiples
- Exploring Data Power View Tiles
- Exploring Data with Hierarchies
- Aesthetic Power View Reports
- Key Performance Indicators
- Excel Data Analysis Resources
- Excel Data Analysis - Quick Guide
- Excel Data Analysis - Resources
- Excel Data Analysis - Discussion
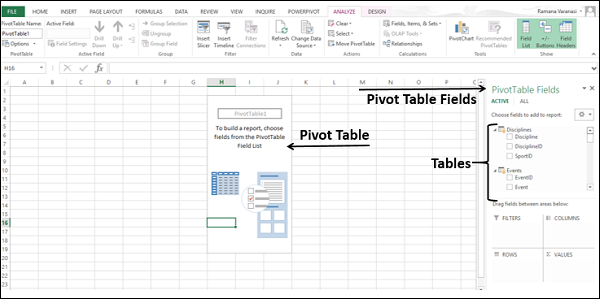
Exploring Data with PivotTables
You can do extensive data analysis using PivotTables and produce desired reports. The integration of Data Model with PivotTable enhances the way the data is collated, connected, summarized and reported. You can import tables from external data sources and create a PivotTable with the imported tables. This facilitates automatic updations of the values in the PivotTable whenever the data in the connected data sources is updated.
Creating a PivotTable to analyze External Data
To create a PivotTable to analyze external data −
- Open a new blank workbook in Excel.
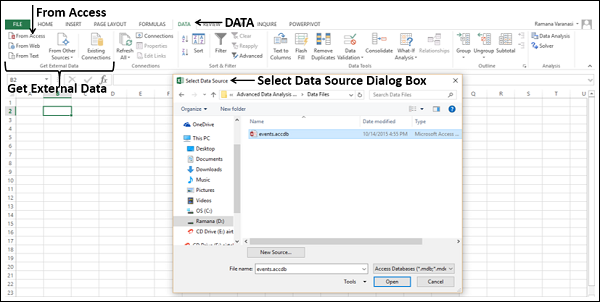
- Click the DATA tab on the Ribbon.
- Click From Access in the Get External Data group. The Select Data Source dialog box appears.
- Select the Access database file.
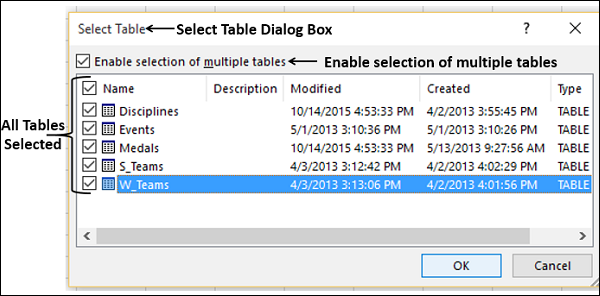
Click the Open button. The Select Table dialog box appears, displaying the tables in the database. Access database is a relational database and the tables will be similar to Excel tables, with the exception that relationships exist among those tables.
Check the box Enable selection of multiple tables.
Select all the tables. Click OK.
The Import Data dialog box appears. Select PivotTable Report. This option imports the tables into your Excel workbook and creates a PivotTable for analyzing the imported tables.
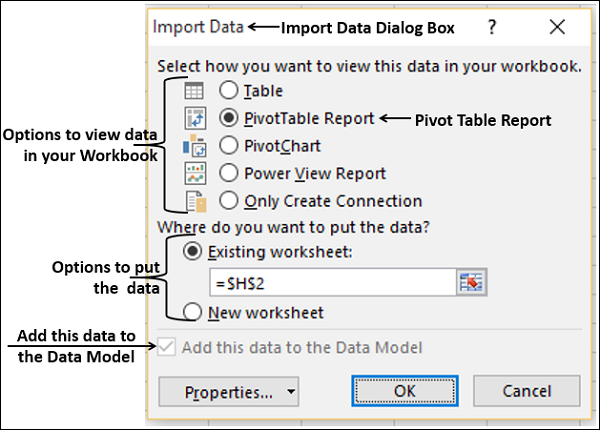
As you observe, the checkbox Add this data to the Data Model is selected and disabled, indicating that the tables will be added to the Data Model automatically.
The data will be imported and an empty PivotTable will be created. The imported tables appear in the PivotTable Fields list.
Exploring Data in Multiple Tables
You can analyze the data from the imported multiple tables with PivotTable and arrive at the specific report you want in just few steps. This is possible because of the pre-existing relationships among the tables in the source database. As you imported all the tables from the database together at the same time, Excel recreates the relationships in its Data Model.
In the PivotTable Fields list, you will find all the tables that you imported and the fields in each of them. If the fields are not visible for any table,
- Click on the arrow next to that table in the PivotTable Fields list.
- The fields in that table will be displayed.
Exploring Data using PivotTable
You know how to add fields to PivotTable and drag fields across areas. Even if you are not sure of the final report that you want, you can play with the data and choose the appropriate report.
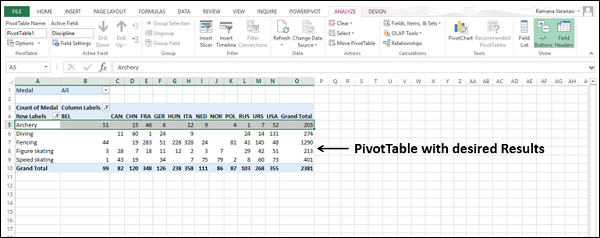
Suppose you want to have a report displaying the following −
- Data for five disciplines - Archery, Diving, Fencing, Figure Skating and Speed Skating.
- Regions that scored more than 80 medals in these 5 disciplines.
- The count of medals in each of the five disciplines in each of these regions.
- Total count of medals for the five disciplines in each of these regions.
You can see how easily you can create this report in few steps.
To start with, create a PivotTable displaying the count of medals in all the regions for the selected five disciplines as follows −
Drag the NOC_CountryRegion field from the Medals table to the COLUMNS area.
Drag Discipline from the Disciplines table to the ROWS area.
Filter Discipline to display only the five disciplines for which you wanted the report. This can be done either in the PivotTable Fields area, or from the Row Labels filter in the PivotTable itself.
Drag Medal from the Medals table to the VALUES area.
Drag Medal from the Medals table to the FILTERS area.
You will get the following PivotTable −
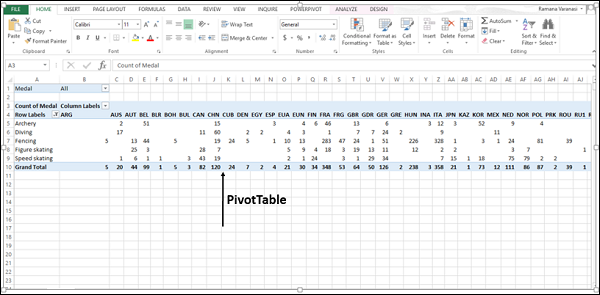
As you observe, Count of Medals is displayed for all the regions and for the five disciplines that you selected. Next, you have to fine-tune this report so that only those regions with total count of medals greater than 80 will be displayed.
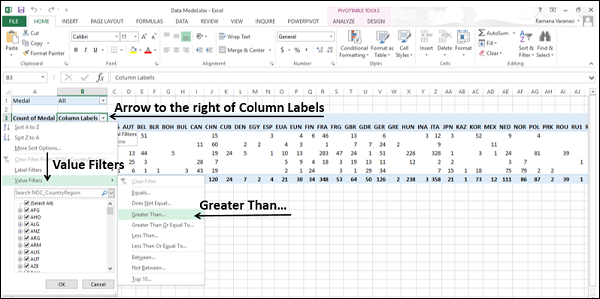
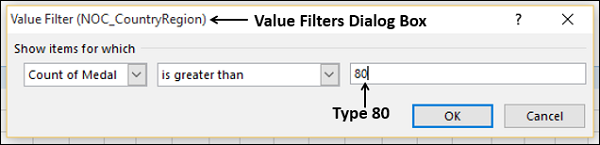
Click the arrow button to the right of Column Labels.
Click Value Filters in the drop-down list that appears.
Select Greater Than from the drop-down list that appears.
Value Filters dialog box appears.
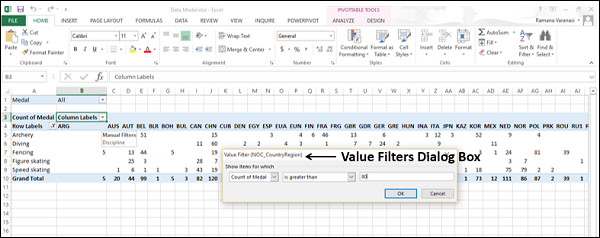
As you observe, Count of Medals and is greater than are displayed in the boxes below Show items for which. Type 80 in the box next to the box containing is greater than and click OK.
Now, the PivotTable displays only those regions with total count of medals in the selected five disciplines greater than 80.
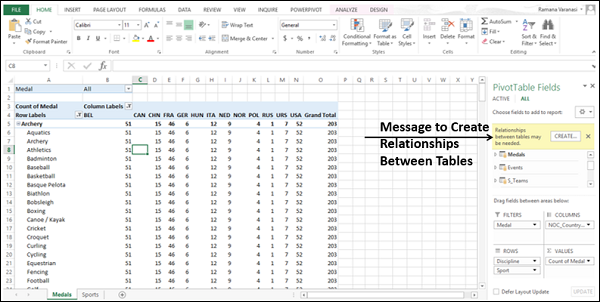
Creating a Relationship between Tables with PivotTable Fields
If you do not import the tables at the same time, if the data is from different sources, or if you add new tables to your workbook, you have to create the relationships among the tables by yourself.
Add a new worksheet with a table that contains Sport and SportID fields to your workbook.
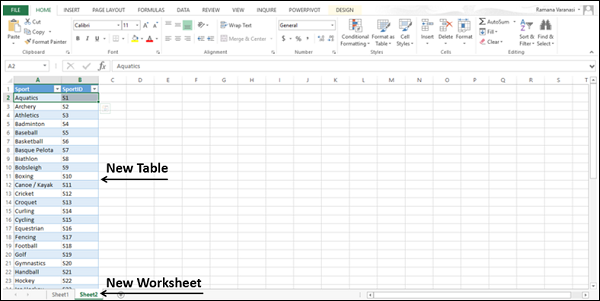
- Name the table - Sports.
- Click ALL in the PivotTable Fields list in the PivotTable worksheet.
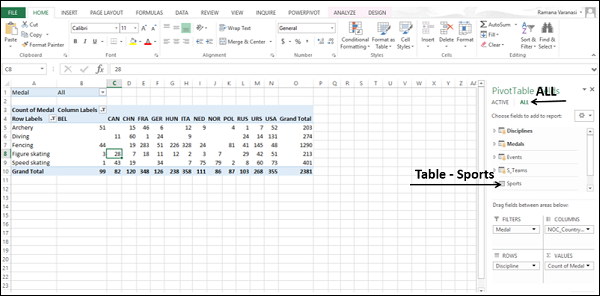
You can see that the newly added table- Sports is also visible in the PivotTable Fields list.
Next, add the field Sport also to the PivotTable as follows −
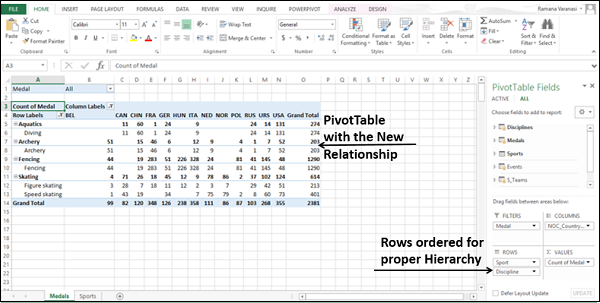
Drag the field Sport from the table Sports to ROWS area. The Sport values appear as Row labels in the PivotTable.
A message will appear in the PivotTable Fields list that Relationships between tables may be needed. A CREATE button appears next to the message.
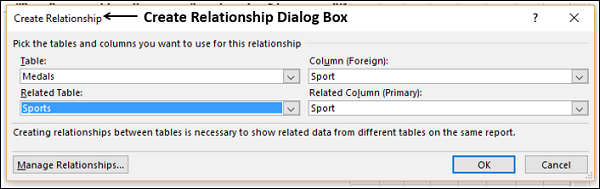
Click the CREATE button. The Create Relationship dialog box appears.
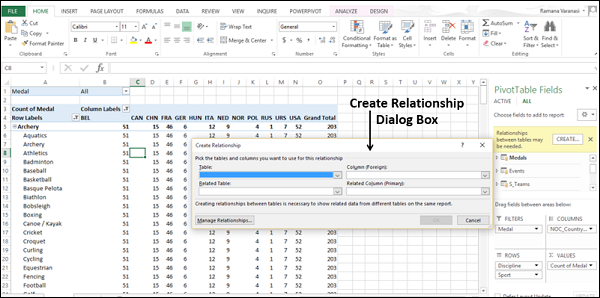
- Select Medals under Table.
- Select Sport under Column.
- Select Sports under Related Table. Sport appears under related column.
- Click OK.
Drag Discipline under Sport in ROWS. This is to define the hierarchy in the PivotTable. The PivotTable displays the Sport and the corresponding group of disciplines for that sport.