- Sublime Text Tutorial
- Sublime Text - Home
- Sublime Text – Introduction
- Sublime Text – Installation
- Sublime Text – Data Directory
- Creating First Document
- Editing First Text Document
- Patterns of Code Editing
- Sublime Text – Sublime Linter
- Sublime Text – Shortcuts
- Sublime Text – Snippets
- Sublime Text – Macros
- Sublime Text – Key Bindings
- Sublime Text – Column Selection
- Sublime Text – Indentation
- Sublime Text – Base Settings
- Sublime Text – Theme Management
- Understanding Vintage Mode
- Sublime Text – Vintage Commands
- Sublime Text – Testing Javascript
- Sublime Text – Testing Python Code
- Sublime Text – Spell Check
- Sublime Text – Packages
- Sublime Text – Menus
- Sublime Text – Sub Menus of Font
- Sublime Text – Developing Plugin
- Sublime Text – Command Palette
- Debugging PHP Application
- Debugging Javascript Application
- Sublime Text – Batch Processing
- Distraction Free Mode
- SublimeCodeIntel Plugin
- Sublime Text Useful Resources
- Sublime Text - Quick Guide
- Sublime Text - Useful Resources
- Sublime Text - Discussion
Sublime Text - Debugging PHP Application
Debugging is the process of finding errors and bugs in the given code and fixing them. Sublime editor includes various plugins that have debugging features, which helps in finding errors easily.
In this chapter, you will learn how to debug a PHP web application. Sublime uses Sublime TestX debug plugin for this purpose. The features of this plugin are −
It is an extension used for debugging the PHP files and scripts.
Provides a list of debugging and profiling capabilities.
Maintains stack traces and real time parameters like display and functionalities.
Installation of Sublime Plugin
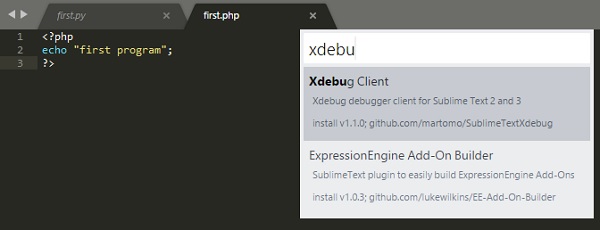
To install Sublime Text Xdebug plugin, you will have to take the following steps −
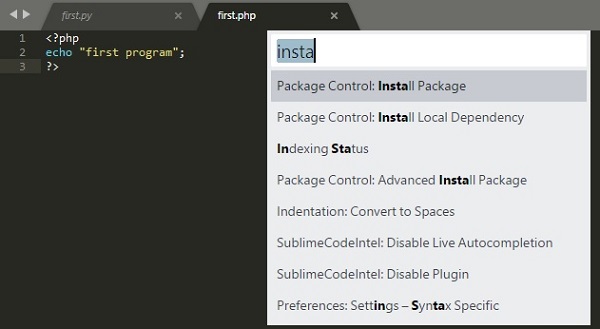
Step 1 − Install package control palette installation with the shortcut of Ctrl+Shift+P or Cmd+shift+P.
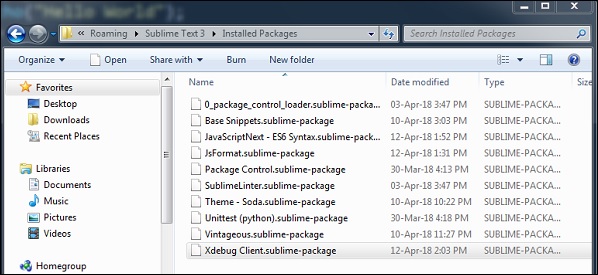
Step 2 − After the successful installation of Xdebug client, the configuration file will be kept in the Installed Packages folder. The configuration file is the JSON file which includes the parameters for debugging a PHP web application.
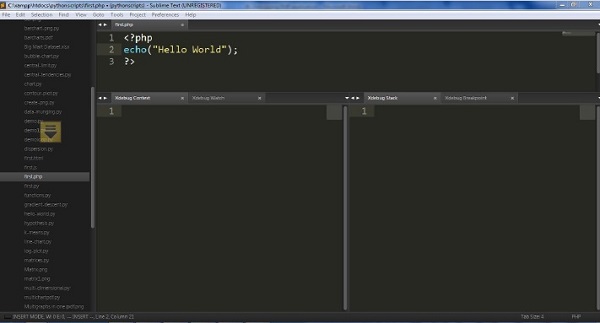
Step 3 − Start the debug session of PHP file using the shortcut Ctrl+F9. You can also do it using the Start Debug option using command palette.
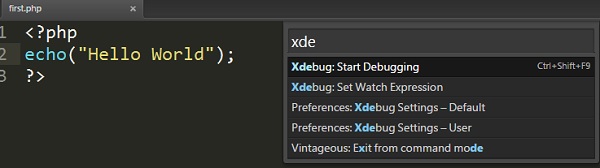
Step 4 − The split windows of XdebugClient will show the output of PHP file. It keeps a process of debugging code line by line. Refer to the following screenshot for a better understanding −
To Continue Learning Please Login