- Kibana Tutorial
- Kibana - Home
- Kibana - Overview
- Kibana - Environment Setup
- Kibana - Introduction To Elk Stack
- Kibana - Loading Sample Data
- Kibana - Management
- Kibana - Discover
- Kibana - Aggregation And Metrics
- Kibana - Create Visualization
- Kibana - Working With Charts
- Kibana - Working With Graphs
- Kibana - Working With Heat Map
- Working With Coordinate Map
- Kibana - Working With Region Map
- Working With Guage And Goal
- Kibana - Working With Canvas
- Kibana - Create Dashboard
- Kibana - Timelion
- Kibana - Dev Tools
- Kibana - Monitoring
- Creating Reports Using Kibana
- Kibana Useful Resources
- Kibana - Quick Guide
- Kibana - Useful Resources
- Kibana - Discussion
Kibana - Overview
Kibana is an open source browser based visualization tool mainly used to analyse large volume of logs in the form of line graph, bar graph, pie charts , heat maps, region maps, coordinate maps, gauge, goals, timelion etc. The visualization makes it easy to predict or to see the changes in trends of errors or other significant events of the input source.Kibana works in sync with Elasticsearch and Logstash which together forms the so called ELK stack.
What is ELK Stack?
ELK stands for Elasticsearch, Logstash, and Kibana. ELK is one of the popular log management platform used worldwide for log analysis. In the ELK stack, Logstash extracts the logging data or other events from different input sources. It processes the events and later stores them in Elasticsearch.
Kibana is a visualization tool, which accesses the logs from Elasticsearch and is able to display to the user in the form of line graph, bar graph, pie charts etc.
The basic flow of ELK Stack is shown in the image here −
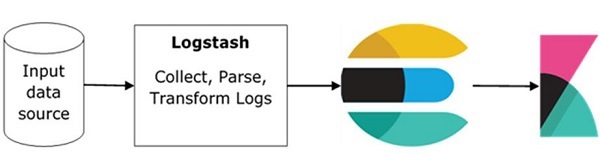
Logstash is responsible to collect the data from all the remote sources where the logs are filed and pushes the same to Elasticsearch.
Elasticsearch acts as a database where the data is collected and Kibana uses the data from Elasticsearch to represent the data to the user in the form of bargraphs, pie charts, heat maps as shown below −
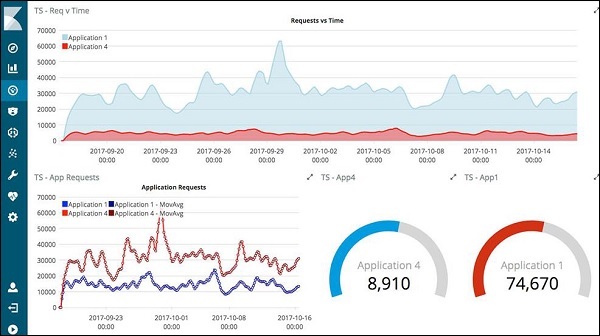
It shows the data on real time basis, for example, day-wise or hourly to the user. Kibana UI is user friendly and very easy for a beginner to understand.
Features of Kibana
Kibana offers its users the following features −
Visualization
Kibana has a lot of ways to visualize data in an easy way. Some of the ones which are commonly used are vertical bar chart, horizontal bar chart, pie chart, line graph, heat map etc.
Dashboard
When we have the visualizations ready, all of them can be placed on one board – the Dashboard. Observing different sections together gives you a clear overall idea about what exactly is happening.
Dev Tools
You can work with your indexes using dev tools. Beginners can add dummy indexes from dev tools and also add, update, delete the data and use the indexes to create visualization.
Reports
All the data in the form of visualization and dashboard can be converted to reports (CSV format), embedded in the code or in the form of URLs to be shared with others.
Filters and Search query
You can make use of filters and search queries to get the required details for a particular input from a dashboard or visualization tool.
Plugins
You can add third party plugins to add some new visualization or also other UI addition in Kibana.
Coordinate and Region Maps
A coordinate and region map in Kibana helps to show the visualization on the geographical map giving a realistic view of the data.
Timelion
Timelion, also called as timeline is yet another visualization tool which is mainly used for time based data analysis. To work with timeline, we need to use simple expression language which helps us connect to the index and also perform calculations on the data to obtain the results we need. It helps more in comparison of data to the previous cycle in terms of week , month etc.
Canvas
Canvas is yet another powerful feature in Kibana. Using canvas visualization, you can represent your data in different colour combinations, shapes, texts, multiple pages basically called as workpad.
Advantages of Kibana
Kibana offers the following advantages to its users −
Contains open source browser based visualization tool mainly used to analyse large volume of logs in the form of line graph, bar graph, pie charts, heat maps etc.
Simple and easy for beginners to understand.
Ease of conversion of visualization and dashboard into reports.
Canvas visualization help to analyse complex data in an easy way.
Timelion visualization in Kibana helps to compare data backwards to understand the performance better.
Disadvantages of Kibana
Adding of plugins to Kibana can be very tedious if there is version mismatch.
You tend to face issues when you want to upgrade from older version to a new one.