- Kibana Tutorial
- Kibana - Home
- Kibana - Overview
- Kibana - Environment Setup
- Kibana - Introduction To Elk Stack
- Kibana - Loading Sample Data
- Kibana - Management
- Kibana - Discover
- Kibana - Aggregation And Metrics
- Kibana - Create Visualization
- Kibana - Working With Charts
- Kibana - Working With Graphs
- Kibana - Working With Heat Map
- Working With Coordinate Map
- Kibana - Working With Region Map
- Working With Guage And Goal
- Kibana - Working With Canvas
- Kibana - Create Dashboard
- Kibana - Timelion
- Kibana - Dev Tools
- Kibana - Monitoring
- Creating Reports Using Kibana
- Kibana Useful Resources
- Kibana - Quick Guide
- Kibana - Useful Resources
- Kibana - Discussion
Kibana - Timelion
Timelion, also called as timeline is yet another visualization tool which is mainly used for time based data analysis. To work with timeline, we need to use simple expression language which will help us connect to the index and also perform calculations on the data to get the results we need.
Where can we use Timelion?
Timelion is used when you want to compare time related data. For example, you have a site, and you get your views daily. You want to analyse the data wherein you want to compare the current week data with previous week, i.e. Monday-Monday, Tuesday -Tuesday and so on how the views are differing and also the traffic.
Getting Started with Timelion
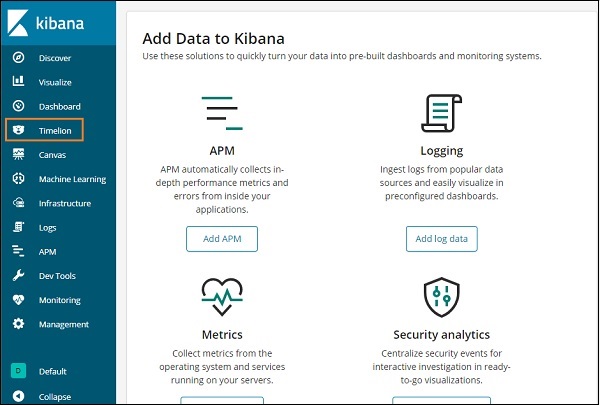
To start working with Timelion, click on Timelion as shown below −
Timelion by default shows the timeline of all indexes as shown below −
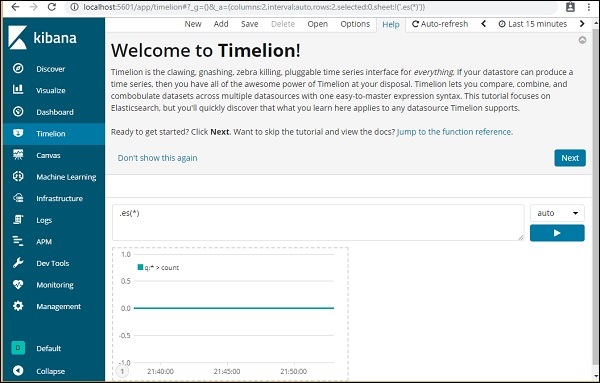
Timelion works with expression syntax.
Note − es(*) => means all indexes.
To get the details of function available to be used with Timelion, simply click on the textarea as shown below −
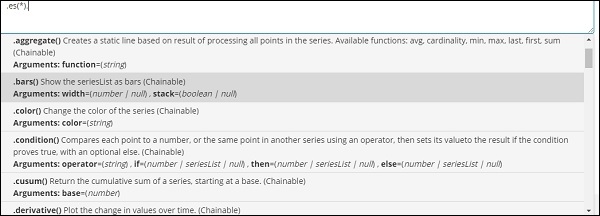
It gives you the list of function to be used with the expression syntax.
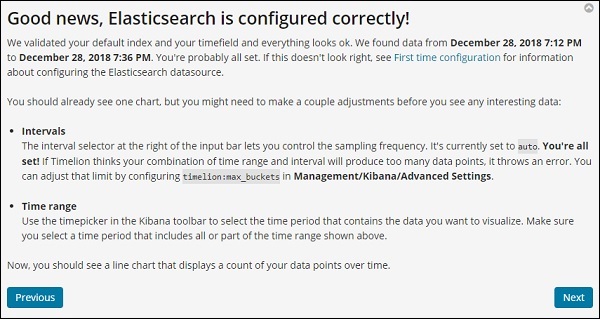
Once you start with Timelion, it displays a welcome message as shown below. The highlighted section i.e. Jump to the function reference, gives the details of all the functions available to be used with timelion.
Timelion Welcome Message
The Timelion welcome message is as shown below −
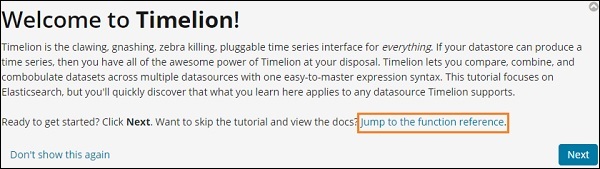
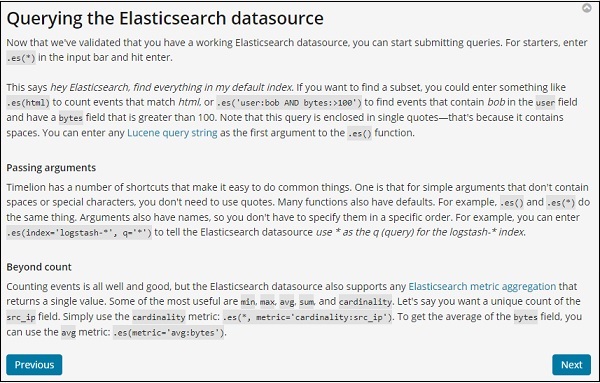
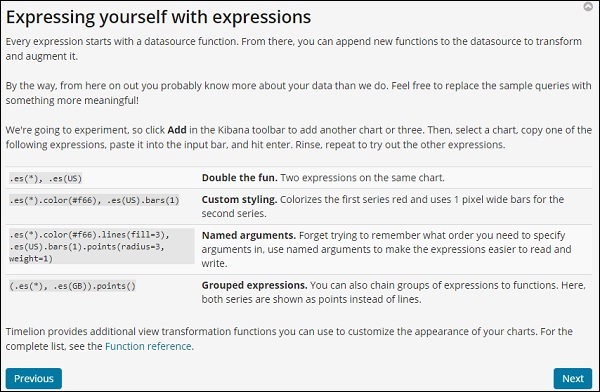
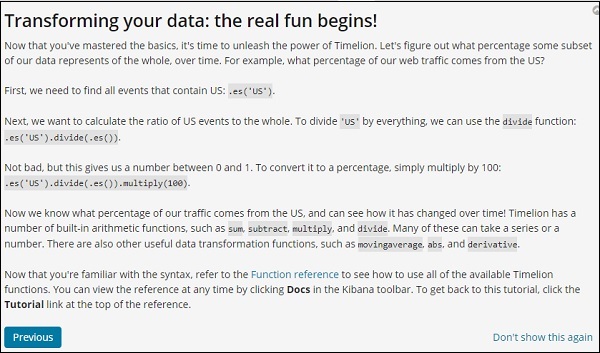
Click on the next button and it will walk you through its basic functionality and usage. Now when you click Next, you can see the following details −
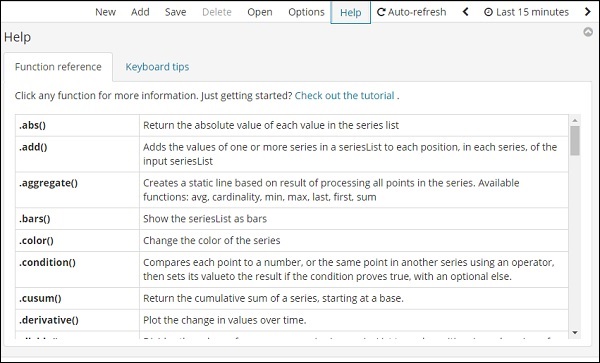
Timelion Function Reference
Click on Help button to get the details of the function reference available for Timelion −
Timelion Configuration
The settings for timelion is done in Kibana Management → Advanced Settings.
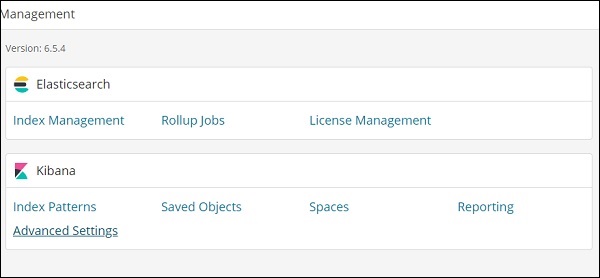
Click on Advanced Settings and select Timelion from Category
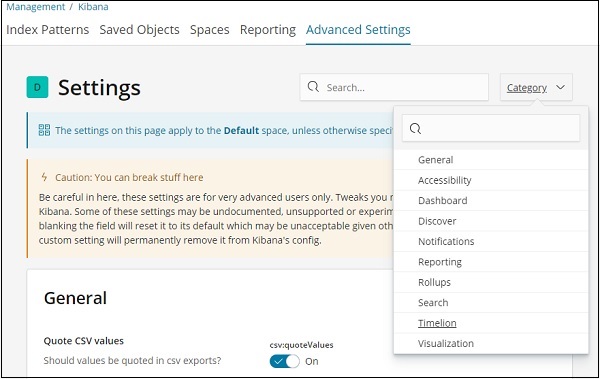
Once Timelion is selected it will display all the necessary fields required for timelion configuration.
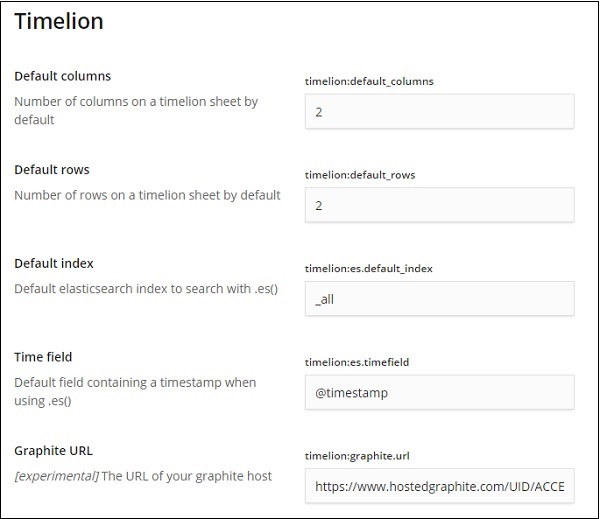
In the following fields you can change the default index and the timefield to be used on the index −
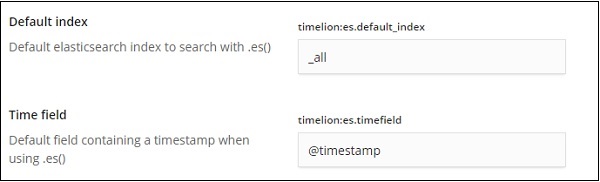
The default one is _all and timefield is @timestamp. We would leave it as it is and change the index and timefield in the timelion itself.
Using Timelion to Visualize Data
We are going to use index:medicalvisits-26.01.2019. The following is the data displayed from timelion for 1st Jan 2017 to 31st Dec 2017 −
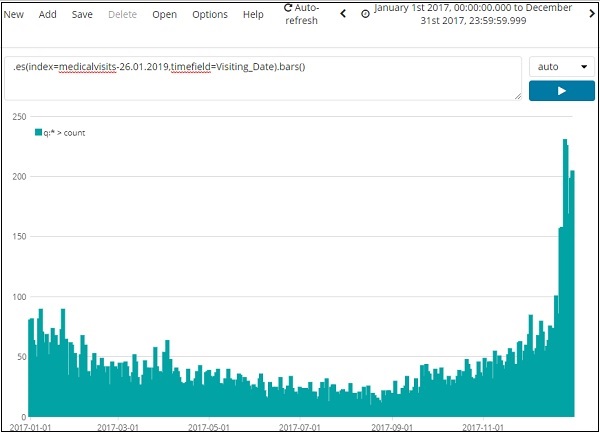
The expression used for above visualization is as follows −
.es(index=medicalvisits-26.01.2019,timefield=Visiting_Date).bars()
We have used the index medicalvisits-26.01.2019 and timefield on that index is Visiting_Date and used bars function.
In the following we have analyzed 2 cities for the month of jan 2017, day wise.
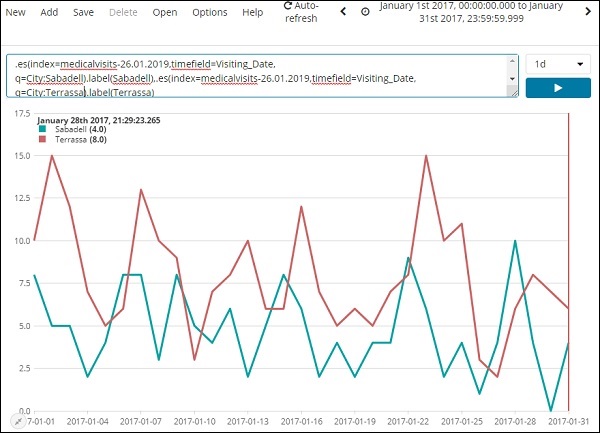
The expression used is −
.es(index=medicalvisits-26.01.2019,timefield=Visiting_Date,
q=City:Sabadell).label(Sabadell),.es(index=medicalvisits-26.01.2019,
timefield=Visiting_Date, q=City:Terrassa).label(Terrassa)
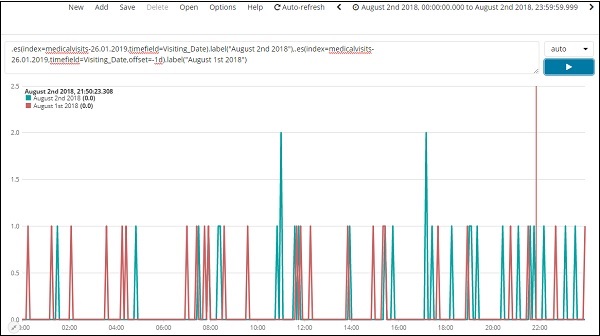
The timeline comparison for 2 days is shown here −
Expression
.es(index=medicalvisits-26.01.2019,timefield=Visiting_Date).label("August 2nd 2018"),
.es(index=medicalvisits-26.01.2019,timefield=Visiting_Date,offset=-1d).label("August 1st 2018")
Here we have used offset and given a difference of 1day. We have selected the current date as 2nd August 2018. So it gives data difference for 2nd Aug 2018 and 1st Aug 2018.
The list of top 5 cities data for the month of Jan 2017 is shown below. The expression that we have used here is given below −
.es(index=medicalvisits-26.01.2019,timefield=Visiting_Date,split=City.keyword:5)
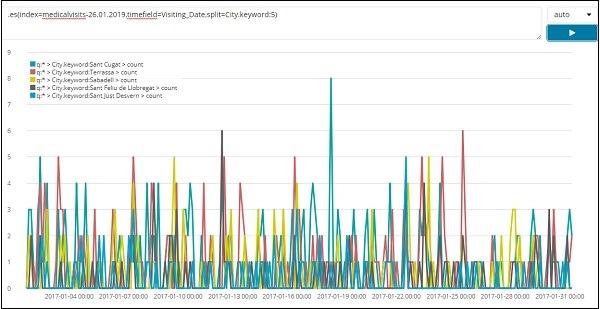
We have used split and given the field name as city and the since we need top five cities from the index we have given it as split=City.keyword:5
It gives the count of each city and lists their names as shown in the graph plotted.