- Kibana Tutorial
- Kibana - Home
- Kibana - Overview
- Kibana - Environment Setup
- Kibana - Introduction To Elk Stack
- Kibana - Loading Sample Data
- Kibana - Management
- Kibana - Discover
- Kibana - Aggregation And Metrics
- Kibana - Create Visualization
- Kibana - Working With Charts
- Kibana - Working With Graphs
- Kibana - Working With Heat Map
- Working With Coordinate Map
- Kibana - Working With Region Map
- Working With Guage And Goal
- Kibana - Working With Canvas
- Kibana - Create Dashboard
- Kibana - Timelion
- Kibana - Dev Tools
- Kibana - Monitoring
- Creating Reports Using Kibana
- Kibana Useful Resources
- Kibana - Quick Guide
- Kibana - Useful Resources
- Kibana - Discussion
Kibana - Discover
This chapter discusses the Discover Tab in Kibana UI. We will learn in detail about the following concepts −
- Index without date field
- Index with date field
Index without date field
Select Discover on the left side menu as shown below −
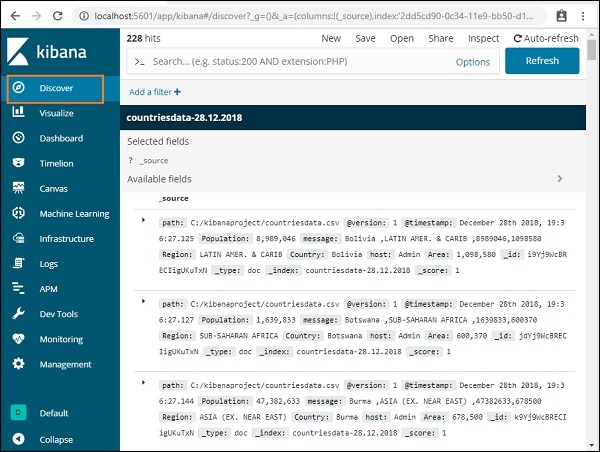
On the right side, it displays the details of the data available in countriesdata- 28.12.2018 index we created in previous chapter.
On the top left corner, it shows the total number of records available −

We can get the details of the data inside the index (countriesdata-28.12.2018) in this tab. On the top left corner in screen shown above, we can see Buttons like New, Save, Open, Share ,Inspect and Auto-refresh.
If you click Auto-refresh, it will display the screen as shown below −
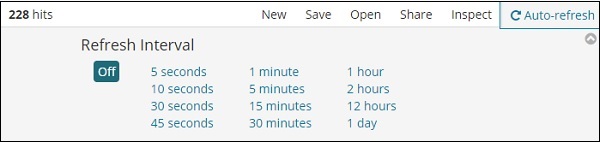
You can set the auto-refresh interval by clicking on the seconds, minutes or hour from above. Kibana will auto-refresh the screen and get fresh data after every interval timer you set.
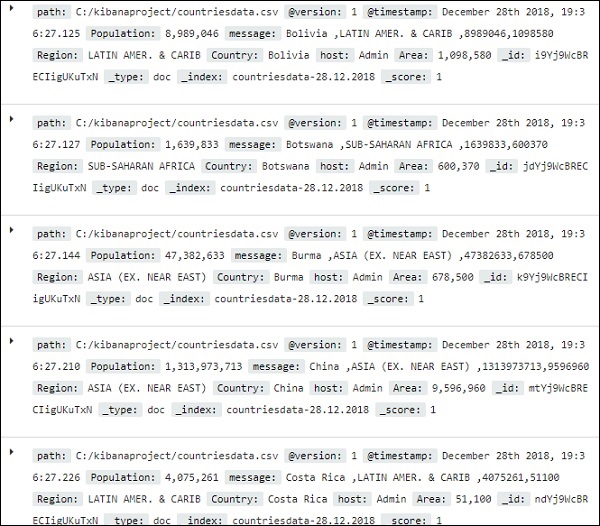
The data from index:countriesdata-28.12.2018 is displayed as shown below −
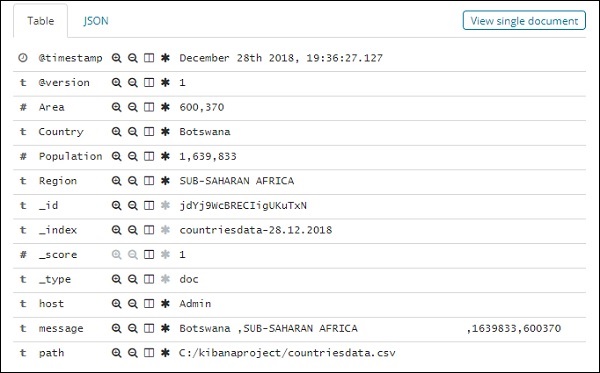
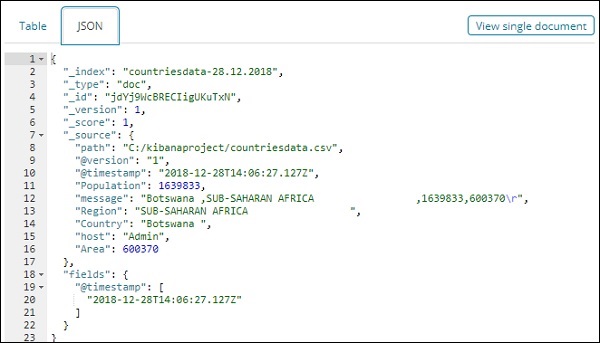
All the fields along with the data are shown row wise. Click the arrow to expand the row and it will give you details in Table format or JSON format
JSON Format
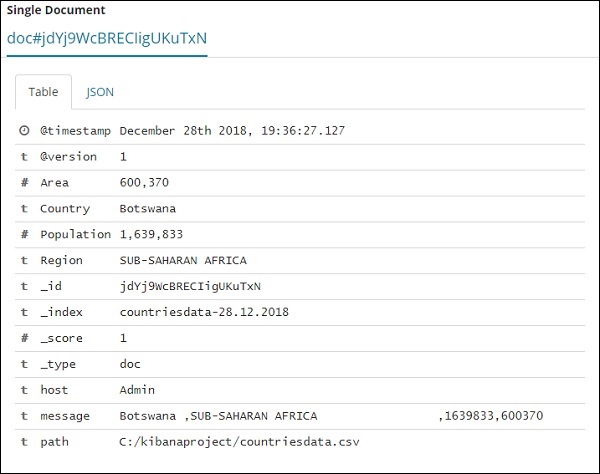
There is a button on the left side called View single document.

If you click it, it will display the row or the data present in the row inside the page as shown below −
Though we are getting all the data details here, it is difficult to go through each of them.
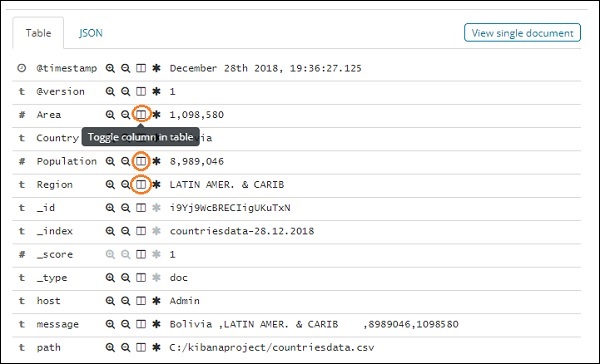
Now let us try to get the data in tabular format. One way to expand one of the row and click the toggle column option available across each field is shown below −
Click on Toggle column in table option available for each and you will notice the data being shown in table format −
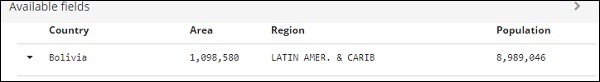
Here, we have selected fields Country, Area, Region and Population. Collapse the expanded row and you should see all the data in tabular format now.
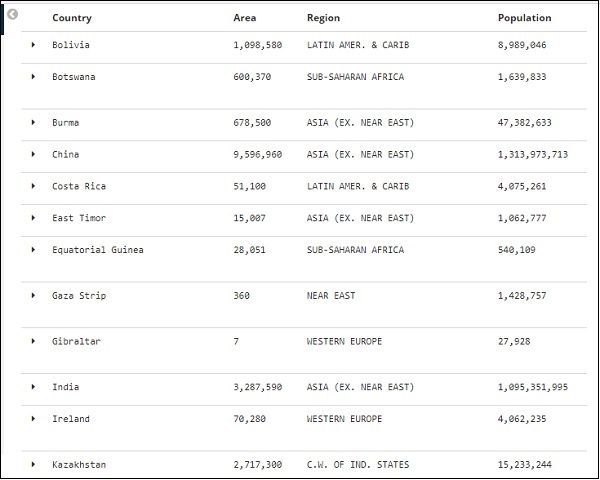
The fields we selected are displayed on the left side of the screen as shown below −
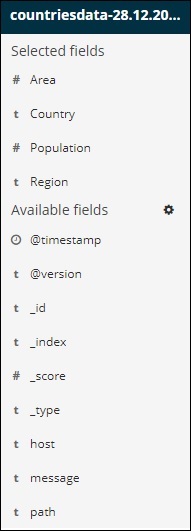
Observe that there are 2 options − Selected fields and Available fields. The fields we have selected to show in tabular format are a part of selected fields. In case you want to remove any field you can do so by clicking the remove button which will be seen across the field name in selected field option.
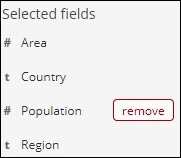
Once removed, the field will be available inside the Available fields where you can add back by clicking the add button which will be shown across the field you want. You can also use this method to get your data in tabular format by choosing the required fields from Available fields.
We have a search option available in Discover, which we can use to search for data inside the index. Let us try examples related to search option here −
Suppose you want to search for country India, you can do as follows −
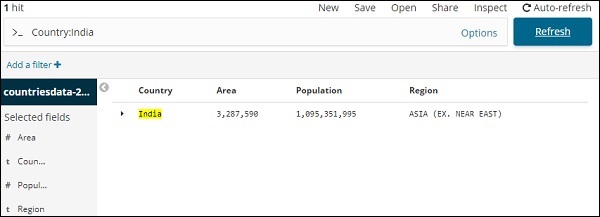
You can type your search details and click the Update button. If you want to search for countries starting with Aus, you can do so as follows −
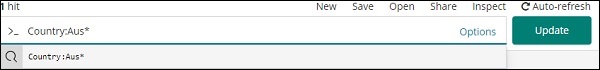
Click Update to see the results
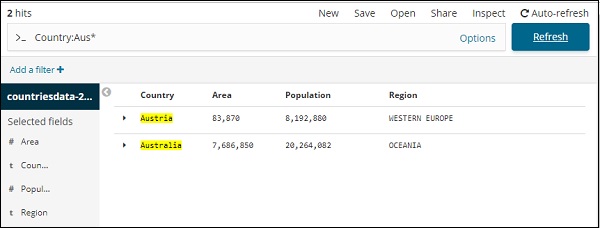
Here, we have two countries starting with Aus*. The search field has a Options button as shown above. When a user clicks it, it displays a toggle button which when ON helps in writing the search query.
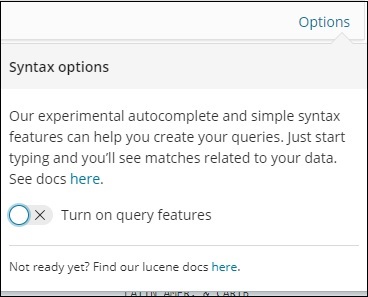
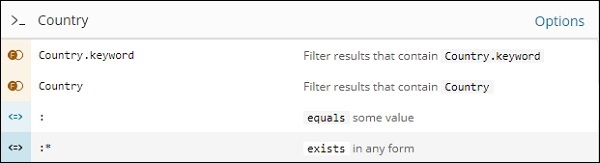
Turn on query features and type the field name in search, it will display the options available for that field.
For example, Country field is a string and it displays following options for the string field −
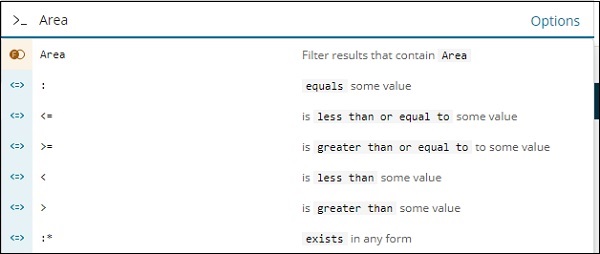
Similarly, Area is a Number field and it displays following options for Number field −
You can try out different combination and filter the data as per your choice in Discover field. The data inside the Discover tab can be saved using the Save button, so that you can use it for future purpose.
To save the data inside discover click on the save button on top right corner as shown below −
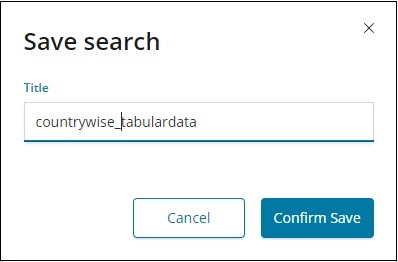
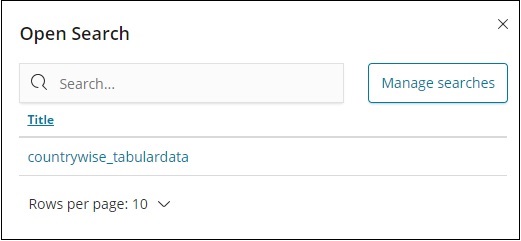
Give title to your search and click Confirm Save to save it. Once saved, next time you visit the Discover tab, you can click the Open button on the top right corner to get the saved titles as shown below −
You can also share the data with others using the Share button available on top right corner. If you click it, you can find sharing options as shown below −
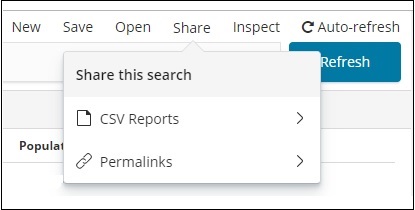
You can share it using CSV Reports or in the form of Permalinks.
The option available onclick on CSV Reports are −
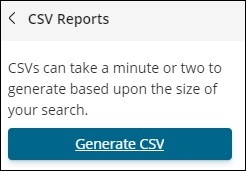
Click Generate CSV to get the report to be shared with others.
The option available onclick of Permalinks are as follows −
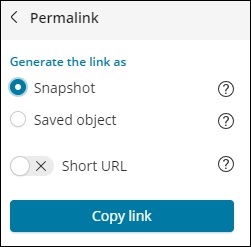
The Snapshot option will give a Kibana link which will display data available in the search currently.
The Saved object option will give a Kibana link which will display the recent data available in your search.
Snapshot − http://localhost:5601/goto/309a983483fccd423950cfb708fabfa5 Saved Object :http://localhost:5601/app/kibana#/discover/40bd89d0-10b1-11e9-9876-4f3d759b471e?_g=()
You can work with Discover tab and search options available and the result obtained can be saved and shared with others.
Index with Date Field
Go to Discover tab and select index:medicalvisits-26.01.2019
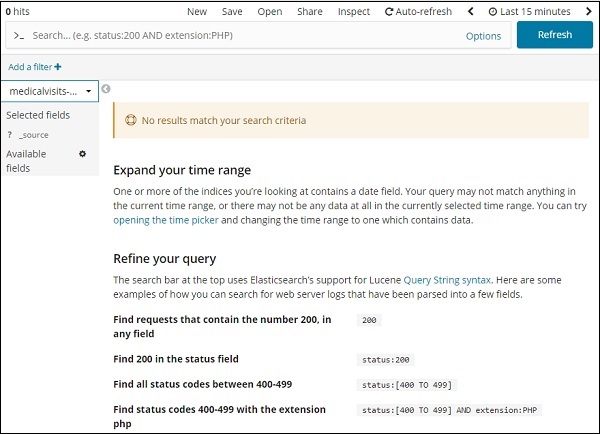
It has displayed the message − “No results match your search criteria”, for the last 15 minutes on the index we have selected. The index has data for years 2015,2016,2017 and 2018.
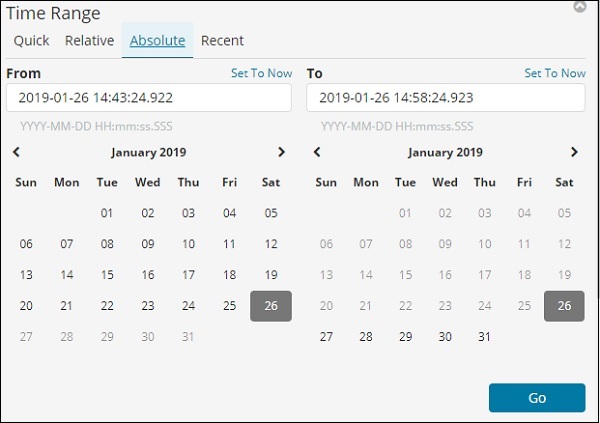
Change the time range as shown below −
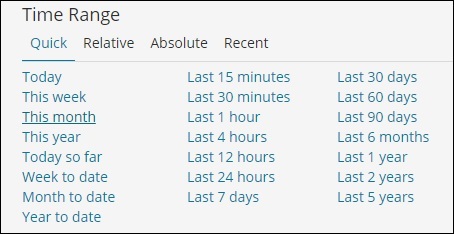
Click Absolute tab.
Select the date From − 1st Jan 2017 and To − 31st Dec2017 as we will analyze data for year 2017.
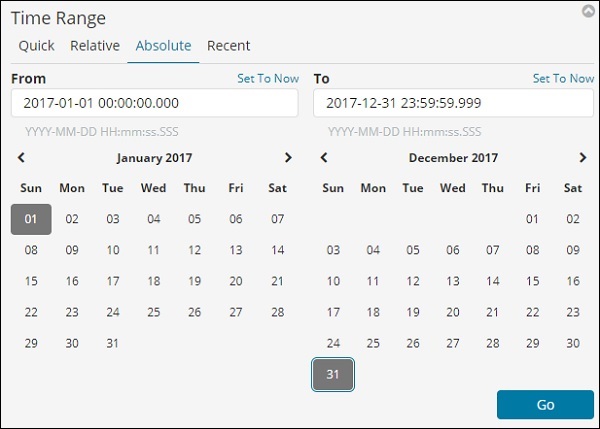
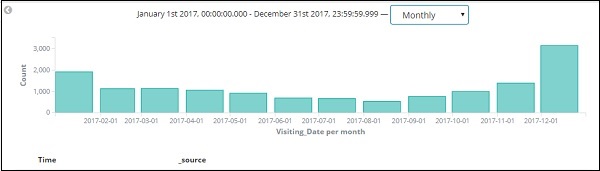
Click the Go button to add the timerange. It will display you the data and bar chart as follows −
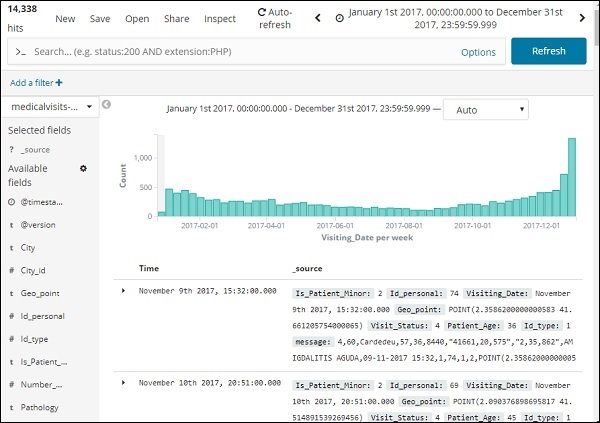
This is the monthly data for the year 2017 −
Since we also have the time stored along with date, we can filter the data on hours and minutes too.
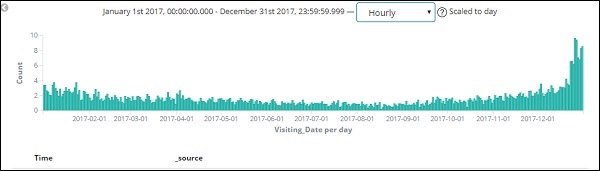
The figure shown above displays the hourly data for the year 2017.
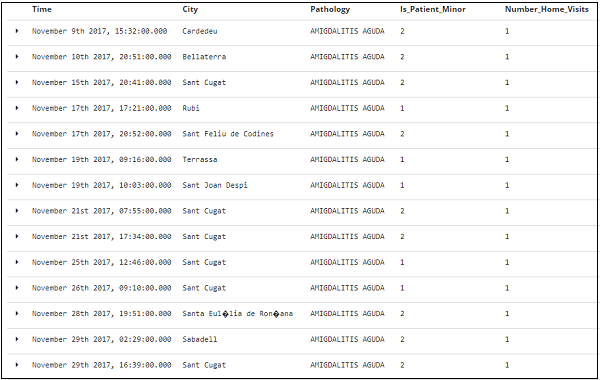
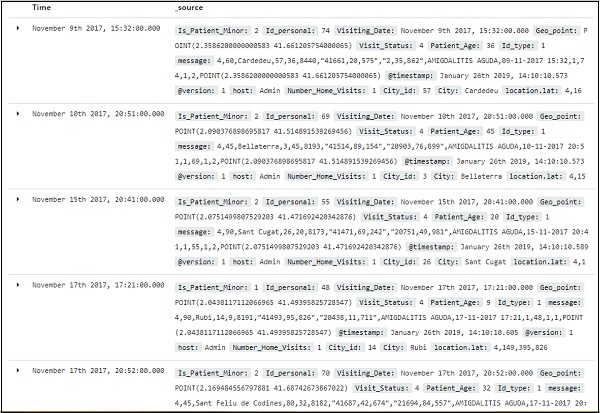
Here the fields displayed from the index − medicalvisits-26.01.2019
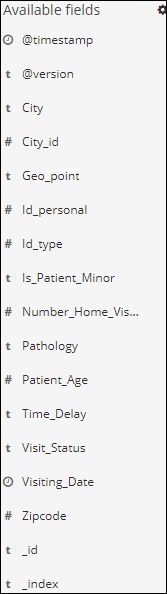
We have the available fields on left side as shown below −
You can select the fields from available fields and convert the data into tabular format as shown below. Here we have selected the following fields −
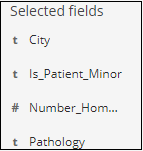
The tabular data for above fields is shown here −