- Kibana Tutorial
- Kibana - Home
- Kibana - Overview
- Kibana - Environment Setup
- Kibana - Introduction To Elk Stack
- Kibana - Loading Sample Data
- Kibana - Management
- Kibana - Discover
- Kibana - Aggregation And Metrics
- Kibana - Create Visualization
- Kibana - Working With Charts
- Kibana - Working With Graphs
- Kibana - Working With Heat Map
- Working With Coordinate Map
- Kibana - Working With Region Map
- Working With Guage And Goal
- Kibana - Working With Canvas
- Kibana - Create Dashboard
- Kibana - Timelion
- Kibana - Dev Tools
- Kibana - Monitoring
- Creating Reports Using Kibana
- Kibana Useful Resources
- Kibana - Quick Guide
- Kibana - Useful Resources
- Kibana - Discussion
Kibana - Creating Reports Using Kibana
Reports can be easily created by using the Share button available in Kibana UI.
Reports in Kibana are available in the following two forms −
- Permalinks
- CSV Report
Report as Permalinks
When performing visualization, you can share the same as follows −
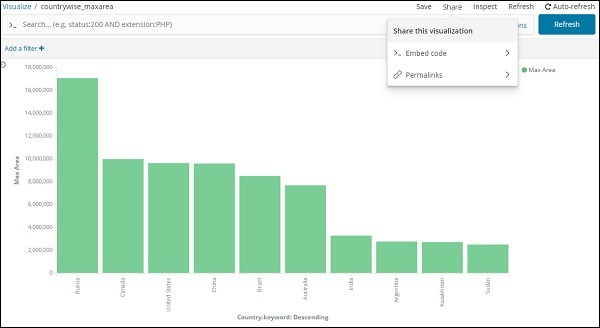
Use the share button to share the visualization with others as Embed Code or Permalinks.
In-case of Embed code you get the following options −
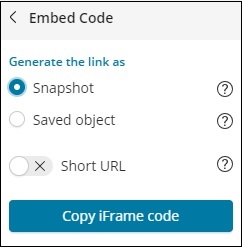
You can generate the iframe code as short url or long url for snapshot or saved object. Snapshot will not give the recent data and user will be able to see the data saved when the link was shared. Any changes done later will not be reflected.
In case of saved object, you will get the recent changes done to that visualization.
Snapshot IFrame code for long url −
<iframe src="http://localhost:5601/app/kibana#/visualize/edit/87af
cb60-165f-11e9-aaf1-3524d1f04792?embed=true&_g=()&_a=(filters:!(),linked:!f,query:(language:lucene,query:''),
uiState:(),vis:(aggs:!((enabled:!t,id:'1',params:(field:Area),schema:metric,type:max),(enabled:!t,id:'2',p
arams:(field:Country.keyword,missingBucket:!f,missingBucketLabel:Missing,order:desc,orderBy:'1',otherBucket:!
f,otherBucketLabel:Other,size:10),schema:segment,type:terms)),params:(addLegend:!t,addTimeMarker:!f,addToo
ltip:!t,categoryAxes:!((id:CategoryAxis-1,labels:(show:!t,truncate:100),position:bottom,scale:(type:linear),
show:!t,style:(),title:(),type:category)),grid:(categoryLines:!f,style:(color:%23eee)),legendPosition:right,
seriesParams:!((data:(id:'1',label:'Max+Area'),drawLi
nesBetweenPoints:!t,mode:stacked,show:true,showCircles:!t,type:histogram,valueAxis:ValueAxis-1)),times:!(),
type:histogram,valueAxes:!((id:ValueAxis-1,labels:(filter:!f,rotate:0,show:!t,truncate:100),name:LeftAxis-1,
position:left,scale:(mode:normal,type:linear),show:!t,style:(),title:(text:'Max+Area'),type:value))),title:
'countrywise_maxarea+',type:histogram))" height="600" width="800"></iframe>
Snapshot Iframe code for short url −
<iframe src="http://localhost:5601/goto/f0a6c852daedcb6b4fa74cce8c2ff6c4?embed=true" height="600" width="800"><iframe>
As snapshot and shot url.
With Short url −
http://localhost:5601/goto/f0a6c852daedcb6b4fa74cce8c2ff6c4
With Short url off, the link looks as below −
http://localhost:5601/app/kibana#/visualize/edit/87afcb60-165f-11e9-aaf1-3524d1f04792?_g=()&_a=(filters:!(
),linked:!f,query:(language:lucene,query:''),uiState:(),vis:(aggs:!((enabled:!t,id:'1',params:(field:Area),
schema:metric,type:max),(enabled:!t,id:'2',params:(field:Country.keyword,missingBucket:!f,missingBucketLabel:
Missing,order:desc,orderBy:'1',otherBucket:!f,otherBucketLabel:Other,size:10),schema:segment,type:terms)),
params:(addLegend:!t,addTimeMarker:!f,addTooltip:!t,categoryAxes:!((id:CategoryAxis-1,labels:(show:!t,trun
cate:100),position:bottom,scale:(type:linear),show:!t,style:(),title:(),type:category)),grid:(categoryLine
s:!f,style:(color:%23eee)),legendPosition:right,seriesParams:!((data:(id:'1',label:'Max%20Area'),drawLines
BetweenPoints:!t,mode:stacked,show:true,showCircles:!t,type:histogram,valueAxis:ValueAxis-1)),times:!(),
type:histogram,valueAxes:!((id:ValueAxis-1,labels:(filter:!f,rotate:0,show:!t,truncate:100),name:LeftAxis-1,
position:left,scale:(mode:normal,type:linear),show:!t,style:(),title:(text:'Max%20Area'),type:value))),title:'countrywise_maxarea%20',type:histogram))
When you hit the above link in the browser, you will get the same visualization as shown above. The above links are hosted locally, so it will not work when used outside the local environment.
CSV Report
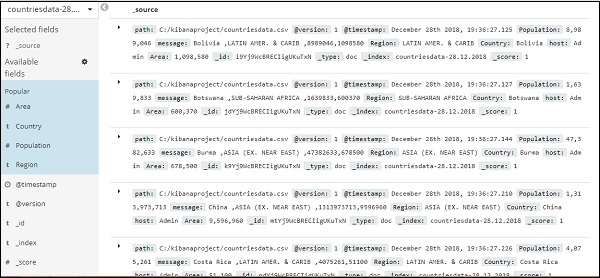
You can get CSV Report in Kibana where there is data, which is mostly in the Discover tab.
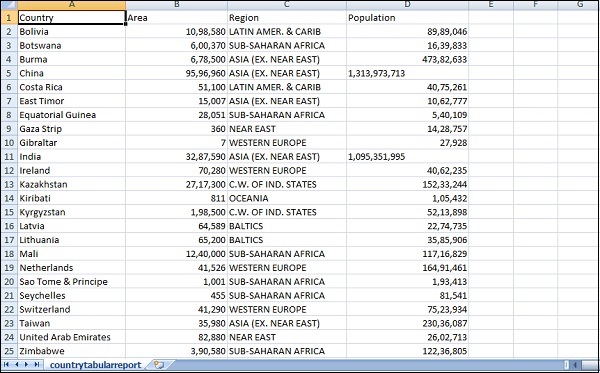
Go to Discover tab and take any index you want the data for. Here we have taken the index:countriesdata-26.12.2018. Here is the data displayed from the index −
You can create tabular data from above data as shown below −
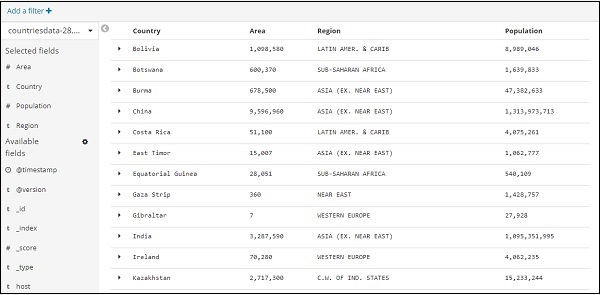
We have selected the fields from Available fields and the data seen earlier is converted into tabular format.
You can get above data in CSV report as shown below −
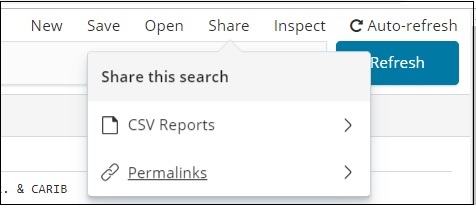
The share button has option for CSV report and permalinks. You can click on CSV Report and download the same.
Please note to get the CSV Reports you need to save your data.
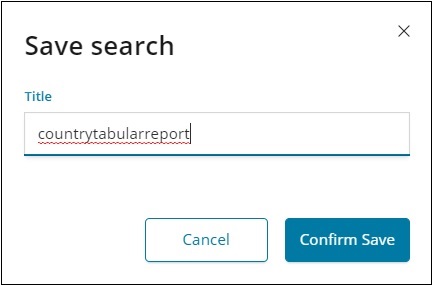
Confirm Save and click on Share button and CSV Reports. You will get following display −
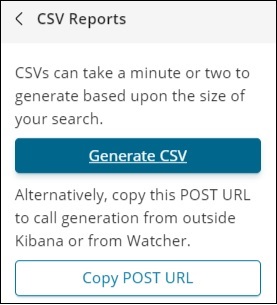
Click on Generate CSV to get your report. Once done, it will instruct you to go the management tab.
Go to Management Tab → Reporting
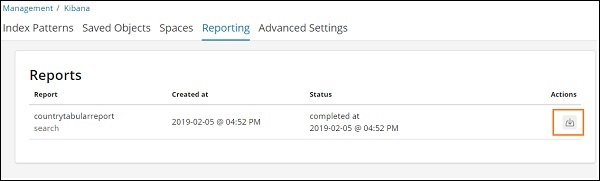
It displays the report name, created at, status and actions. You can click on the download button as highlighted above and get your csv report.
The CSV file we just downloaded is as shown here −