- Kibana Tutorial
- Kibana - Home
- Kibana - Overview
- Kibana - Environment Setup
- Kibana - Introduction To Elk Stack
- Kibana - Loading Sample Data
- Kibana - Management
- Kibana - Discover
- Kibana - Aggregation And Metrics
- Kibana - Create Visualization
- Kibana - Working With Charts
- Kibana - Working With Graphs
- Kibana - Working With Heat Map
- Working With Coordinate Map
- Kibana - Working With Region Map
- Working With Guage And Goal
- Kibana - Working With Canvas
- Kibana - Create Dashboard
- Kibana - Timelion
- Kibana - Dev Tools
- Kibana - Monitoring
- Creating Reports Using Kibana
- Kibana Useful Resources
- Kibana - Quick Guide
- Kibana - Useful Resources
- Kibana - Discussion
Kibana - Introduction To Elk Stack
Kibana is an open source visualization tool mainly used to analyze a large volume of logs in the form of line graph, bar graph, pie charts, heatmaps etc. Kibana works in sync with Elasticsearch and Logstash which together forms the so called ELK stack.
ELK stands for Elasticsearch, Logstash, and Kibana. ELK is one of the popular log management platform used worldwide for log analysis.
In the ELK stack −
Logstash extracts the logging data or other events from different input sources. It processes the events and later stores it in Elasticsearch.
Kibana is a visualization tool, which accesses the logs from Elasticsearch and is able to display to the user in the form of line graph, bar graph, pie charts etc.
In this tutorial, we will work closely with Kibana and Elasticsearch and visualize the data in different forms.
In this chapter, let us understand how to work with ELK stack together. Besides, you will also see how to −
- Load CSV data from Logstash to Elasticsearch.
- Use indices from Elasticsearch in Kibana.
Load CSV data from Logstash to Elasticsearch
We are going to use CSV data to upload data using Logstash to Elasticsearch. To work on data analysis, we can get data from kaggle.com website. Kaggle.com site has all types of data uploaded and users can use it to work on data analysis.
We have taken the countries.csv data from here: https://www.kaggle.com/fernandol/countries-of-the-world. You can download the csv file and use it.
The csv file which we are going to use has following details.
File name − countriesdata.csv
Columns − "Country","Region","Population","Area"
You can also create a dummy csv file and use it. We will be using logstash to dump this data from countriesdata.csv to elasticsearch.
Start the elasticsearch and Kibana in your terminal and keep it running. We have to create the config file for logstash which will have details about the columns of the CSV file and also other details as shown in the logstash-config file given below −
input {
   file {
      path => "C:/kibanaproject/countriesdata.csv"
      start_position => "beginning"
      sincedb_path => "NUL"
   }
}
filter {
   csv {
      separator => ","
      columns => ["Country","Region","Population","Area"]
   }
   mutate {convert => ["Population", "integer"]}
   mutate {convert => ["Area", "integer"]}
}
output {
   elasticsearch {
      hosts => ["localhost:9200"]
      => "countriesdata-%{+dd.MM.YYYY}"
   }
   stdout {codec => json_lines }
}
In the config file, we have created 3 components −
Input
We need to specify the path of the input file which in our case is a csv file. The path where the csv file is stored is given to the path field.
Filter
Will have the csv component with separator used which in our case is comma, and also the columns available for our csv file. As logstash considers all the data coming in as string , in-case we want any column to be used as integer , float the same has to be specified using mutate as shown above.
Output
For output, we need to specify where we need to put the data. Here, in our case we are using elasticsearch. The data required to be given to the elasticsearch is the hosts where it is running, we have mentioned it as localhost. The next field in is index which we have given the name as countries-currentdate. We have to use the same index in Kibana once the data is updated in Elasticsearch.
Save the above config file as logstash_countries.config. Note that we need to give the path of this config to logstash command in the next step.
To load the data from the csv file to elasticsearch, we need to start the elasticsearch server −
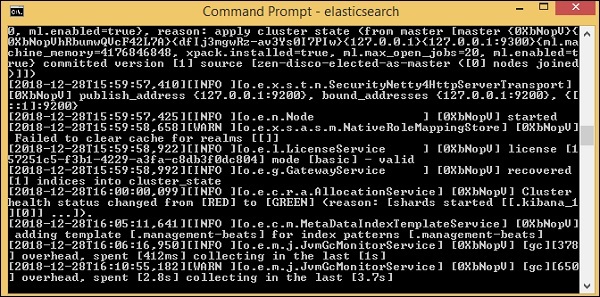
Now, run http://localhost:9200 in the browser to confirm if elasticsearch is running successfully.
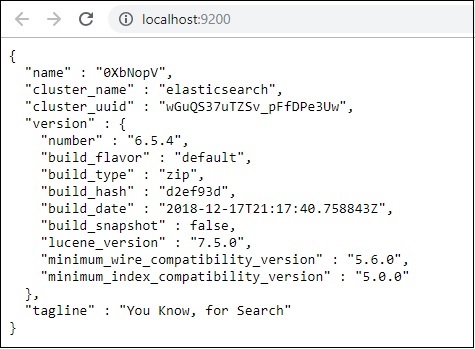
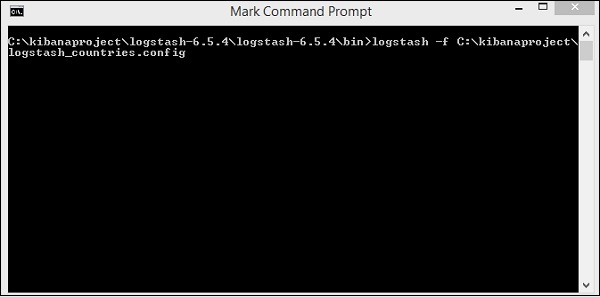
We have elasticsearch running. Now go to the path where logstash is installed and run following command to upload the data to elasticsearch.
> logstash -f logstash_countries.conf
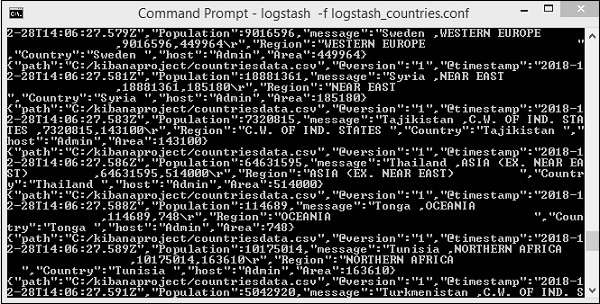
The above screen shows data loading from the CSV file to Elasticsearch. To know if we have the index created in Elasticsearch we can check same as follows −
We can see the countriesdata-28.12.2018 index created as shown above.
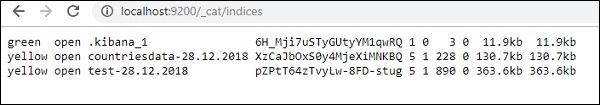
The details of the index − countries-28.12.2018 is as follows −
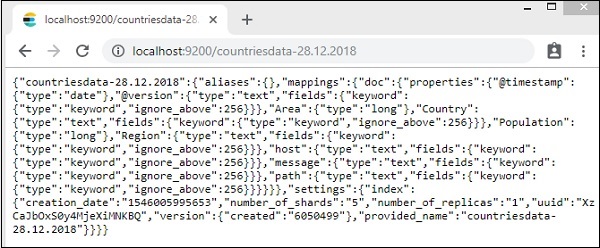
Note that the mapping details with properties are created when data is uploaded from logstash to elasticsearch.
Use Data from Elasticsearch in Kibana
Currently, we have Kibana running on localhost, port 5601 − http://localhost:5601. The UI of Kibana is shown here −
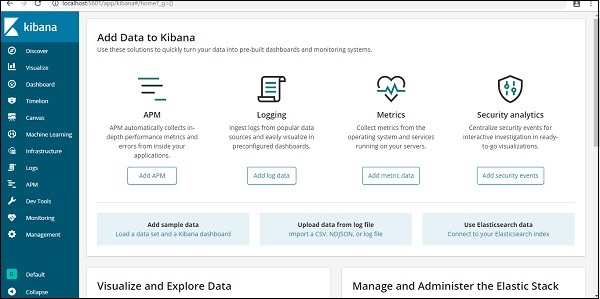
Note that we already have Kibana connected to Elasticsearch and we should be able to see index :countries-28.12.2018 inside Kibana.
In the Kibana UI, click on Management Menu option on left side −
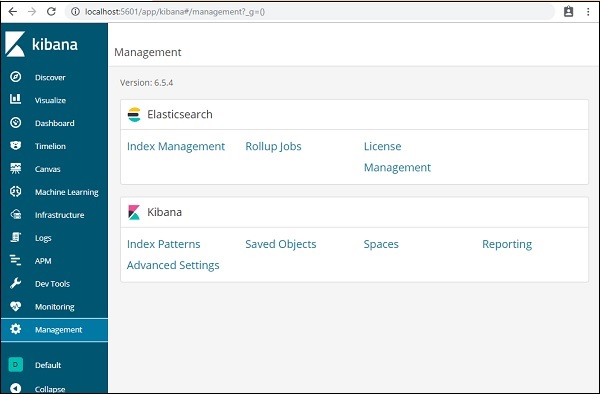
Now, click Index Management −
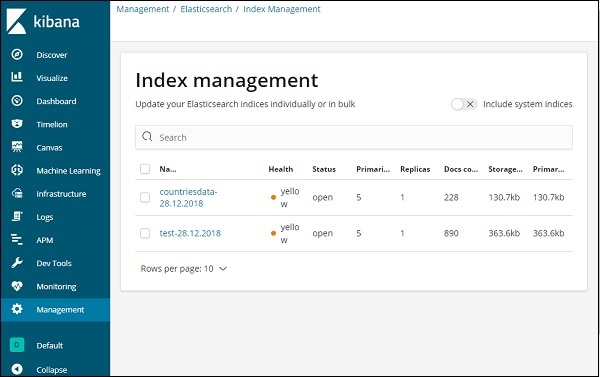
The indices present in Elasticsearch are displayed in index management. The index we are going to use in Kibana is countriesdata-28.12.2018.
Thus, as we already have the elasticsearch index in Kibana, next will understand how to use the index in Kibana to visualize data in the form of pie chart, bar graph, line chart etc.