- SAP Solman - Home
- SAP Solman - Overview
- SAP Solman - Features
- SAP Solman - Work Center
- SAP Solman - Work Center Structure
- SAP Solman - Implementation
- SAP Solman - Infrastructure
- SAP Solman - Operations
- System Landscape Information
- Guided Procedure Authoring
- SAP Solman - Template Mngmt
- SAP Solman - Test Management
- SAP Solman - IT Task Management
- Change Control Management
- SAP Solman - Incident Management
- SAP Solman - Service Desk
- Business Process Operations
- Application Operations
- Maintenance Management
- SAP Solman - Upgrade Project
- SAP Solman - Root Cause Analysis
- SAP Solman - Reporting
- Consultant Responsibilities
- SAP Solman - Questions Answers
- SAP Solman - Quick Guide
- SAP Solman - Useful Resources
- SAP Solman - Discussion
SAP Solman - Reporting
You can create various interactive reports and Dashboards in SAP Solution Manager.
Interactive Reporting
Interactive reporting allows you to display most important metrics of the objects in System Landscape. The following object types are available −
- Systems
- Hosts
- Databases
- Scenarios
You can use SAP BW system to move these metrics. Reports are created to get a quick view of the Key Performance Indicators. Reports can be created for the following metric values
- Capacity Reports
- Availability Reports
- Performance Reports
- Usage
Application Dashboards
Application Dashboards allow you create Dashboards to ensure that your technical systems and scenarios are available and performing as per the requirement. Application Dashboard can show the following values
- System Availability
- System Performance
- EUE Reporting
Service Level Reporting
Service Level Reporting is used to monitor internal and external service level agreement. This report is based on SAP Early Watch Alert. This report consistently performs check on KPIs
- System Availability
- Threshold Report
- Periodic reports as per specific time period.
Note − The Service Level Reports can be stored in HTML format or MS Word format.
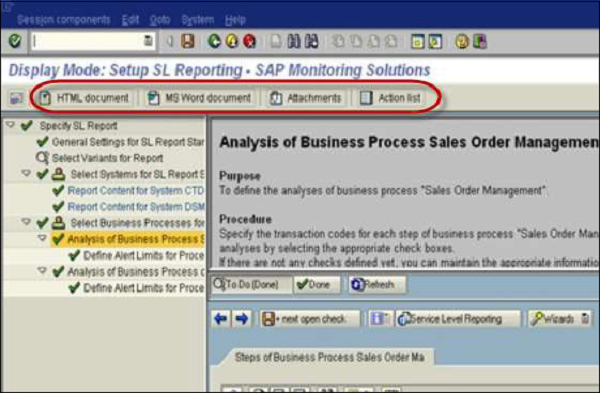
To create a Service Level Report, go to Service Level Report view.
To create HTML report
- Select the link to a Service Level Report.
- In HTML format, you can the report in mail as an attachment to multiple recipients.
To create MS Word document report
To get Service Level Report in doc format, click the Word format symbol and select the report that you want in Doc format. This report comes as an attachment in Report view.
