IPython
- IPython - Introduction
- IPython - Installation
- IPython - Getting Started
- Running & Editing Python Script
- IPython - History Command
- IPython - System Commands
- IPython - Command Line Options
- Dynamic Object Introspection
- IPython - IO Caching
- Setting IPython as Default Python Environment
- Importing Python Shell Code
- IPython - Embedding IPython
- IPython - Magic Commands
Jupyter
- Project Jupyter - Overview
- Jupyter Notebook - Introduction
- Working With Jupyter Online
- Installation and Getting Started
- Jupyter Notebook - Dashboard
- Jupyter Notebook - User Interface
- Jupyter Notebook - Types of Cells
- Jupyter Notebook - Editing
- Jupyter Notebook - Markdown Cells
- Cell Magic Functions
- Jupyter Notebook - Plotting
- Converting Notebooks
- Jupyter Notebook - IPyWidgets
QtConsole
- QtConsole - Getting Started
- QtConsole - Multiline Editing
- QtConsole - Inline Graphics
- QtConsole - Save to Html
- QtConsole - Multiple Consoles
- Connecting to Jupyter Notebook
- Using github and nbviewer
JupyterLab
- JupyterLab - Overview
- Installation & Getting Started
- JupyterLab - Interface
- JupyterLab - Installing R Kernel
Jupyter Resources
Jupyter Notebook - Plotting
IPython kernel of Jupyter notebook is able to display plots of code in input cells. It works seamlessly with matplotlib library. The inline option with the %matplotlib magic function renders the plot out cell even if show() function of plot object is not called. The show() function causes the figure to be displayed below in[] cell without out[] with number.

Now, add plt.show() at the end and run the cell again to see the difference.
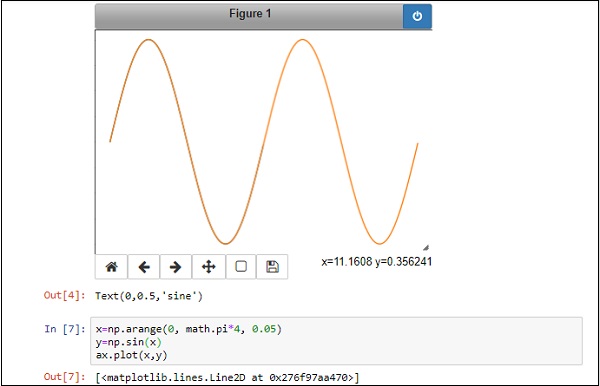
Note that the %matplotlib notebook magic renders interactive plot.
Just below the figure, you can find a tool bar to switch views, pan, zoom and download options.

Importantly, if you modify the data underneath the plot, the display changes dynamically without drawing another plot.
In the above example, change the data sets of x and y in the cell below and plot the figure again, the figure above will get dynamically refreshed.