
Article Categories
- All Categories
-
 Data Structure
-
 Networking
-
 RDBMS
RDBMS
-
 Operating System
-
 Java
Java
-
 MS Excel
-
 iOS
iOS
-
 HTML
HTML
-
 CSS
CSS
-
 Android
-
 Python
-
 C Programming
-
 C++
C++
-
 C#
C#
-
 MongoDB
-
 MySQL
MySQL
-
 Javascript
-
 PHP
PHP
-
 Economics & Finance
Selected Reading
How to create boxplot with horizontal lines on the minimum and maximum in R?
A boxplot shows the minimum, first quartile, median, third quartile, and maximum. When we create a boxplot with ggplot2 it shows the boxplot without horizontal lines on the minimum and maximum, if we want to create the horizontal lines we can use stat_boxplot(geom= 'errorbar') with ggplot function of ggplot2.
Example
Consider the below data frame −
set.seed(101)
Gender <-rep(c("Male","Female"),times=100)
Salary <-sample(20000:50000,200,replace=TRUE)
df <-data.frame(Gender,Salary)
head(df,20)
Output
  Gender Salary
1 Male 44392
2 Female 22872
3 Male 33741
4 Female 30334
5 Male 36374
6 Female 39664
7 Male 25561
8 Female 41854
9 Male 27996
10 Female 23003
11 Male 44890
12 Female 33557
13 Male 35202
14 Female 48287
15 Male 49826
16 Female 25919
17 Male 41000
18 Female 34687
19 Male 46978
20 Female 22530
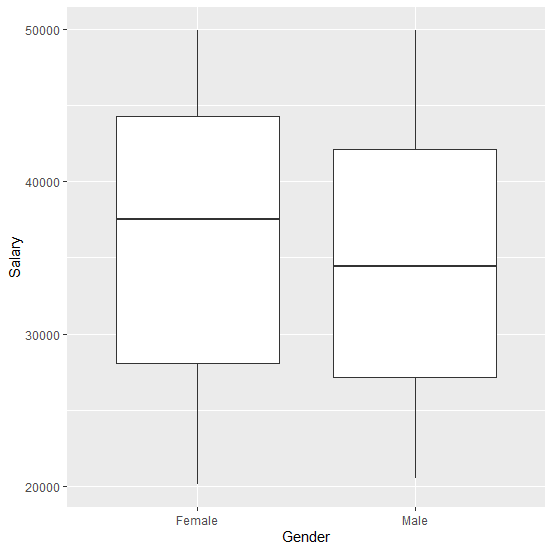
Creating a simple boxplot −
Example
library(ggplot2)
ggplot(df,aes(Gender,Salary))+geom_boxplot()
Output
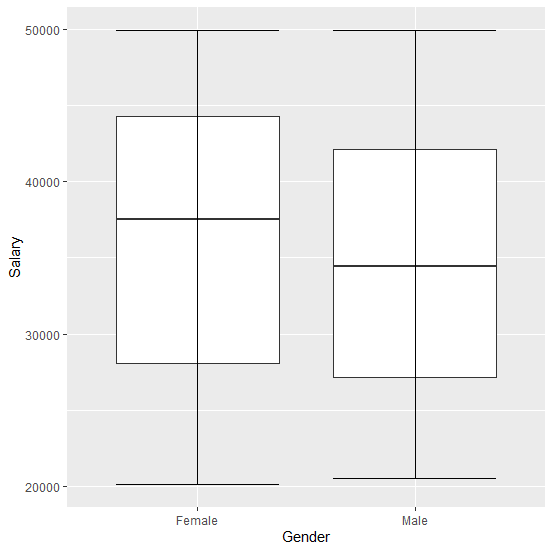
Creating the boxplot with horizontal lines on the minimum and maximum −
Example
ggplot(df,aes(Gender,Salary))+geom_boxplot()+stat_boxplot(geom='errorbar')
Output

Updated on: 2020-08-24T13:01:22+05:30
1K+ Views

Advertisements