
Article Categories
- All Categories
-
 Data Structure
-
 Networking
-
 RDBMS
RDBMS
-
 Operating System
-
 Java
Java
-
 MS Excel
-
 iOS
iOS
-
 HTML
HTML
-
 CSS
CSS
-
 Android
-
 Python
-
 C Programming
-
 C++
C++
-
 C#
C#
-
 MongoDB
-
 MySQL
MySQL
-
 Javascript
-
 PHP
PHP
-
 Economics & Finance
How to remove end lines from a boxplot in R?
The default boxplot in R has straight lines that display end point(s) excluding outliers. To remove these end lines from a boxplot, we can use staplelty argument and set it to 0.
For Example, if we have a vector called X then we can create the boxplot of X by using the command given below −
boxplot(X,staplelty=0)
Example
Following snippet creates a sample data frame −
x<-rnorm(50)
x
The following dataframe is created −
[1] 1.07121252 1.33229928 -0.42979966 -1.40995208 0.48278802 1.26974280
[7] -0.18708219 -0.58137514 0.16521442 -0.43517266 -2.02958751 0.82642167
[13] -0.04839166 -0.18796889 -0.58046680 1.06183907 1.75152677 -0.21844277
[19] -1.16105995 -1.88977975 -0.96235323 0.29656000 0.23496739 0.25570062
[25] 0.08670790 0.66332777 -1.40964394 -1.04917889 1.18508295 0.55464251
[31] -1.10323516 1.23891058 -0.45801561 -0.59213378 0.56396096 0.61541679
[37] -0.12930322 -1.39358818 -0.01933885 0.92691397 -0.94091424 1.31399699
[43] -0.58829131 -1.22637501 -1.34721110 -0.71175576 -1.40008529 -1.24131492
[49] -1.25884801 0.91932581
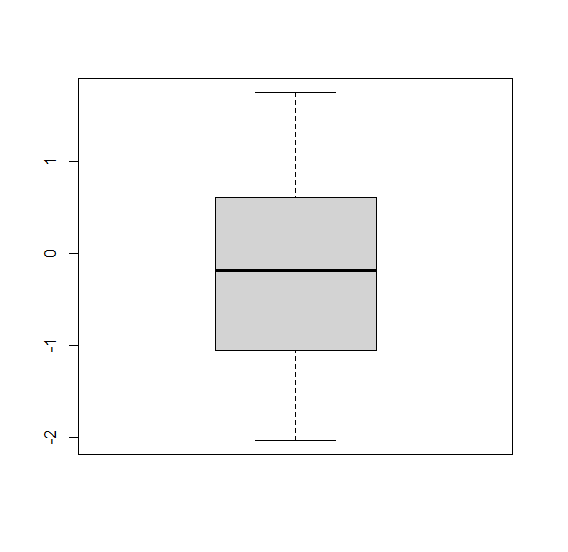
To create a boxplot of x on the above created data frame, add the following code to the above snippet −
x<-rnorm(50)
boxplot(x)
Output
If you execute all the above given snippets as a single program, it generates the following Output −
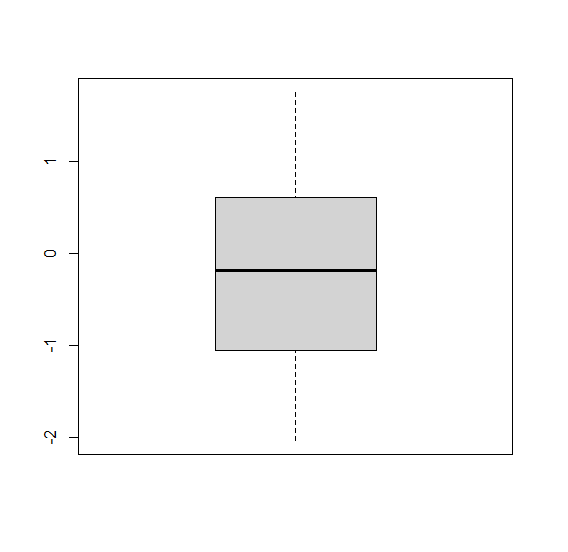
To create a boxplot of x without end lines on the above created data frame, add the following code to the above snippet −
x<-rnorm(50)
boxplot(x)
boxplot(x,staplelty=0)
Output
If you execute all the above given snippets as a single program, it generates the following Output −

805 Views
