
Article Categories
- All Categories
-
 Data Structure
-
 Networking
-
 RDBMS
RDBMS
-
 Operating System
-
 Java
Java
-
 MS Excel
-
 iOS
iOS
-
 HTML
HTML
-
 CSS
CSS
-
 Android
-
 Python
-
 C Programming
-
 C++
C++
-
 C#
C#
-
 MongoDB
-
 MySQL
MySQL
-
 Javascript
-
 PHP
PHP
-
 Economics & Finance
Selected Reading
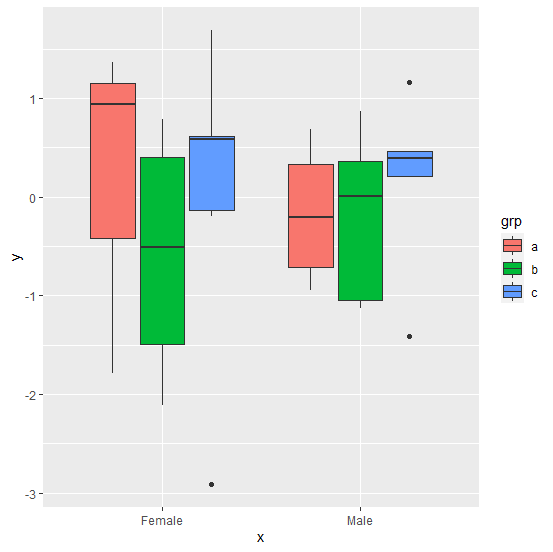
How to create boxplot with multiple factor levels using ggplot2 in R?
To create a boxplot, we have one factor and one numerical column and the boxplot is created for each category or levels in that factor. Now if we have two factors then the boxplot can be created for both factor levels by passing fill argument in geom_boxplot. This will help us to differentiate between the boxplots for the two factors. Check out the below examples to understand how it works.
Example
Consider the below data frame −
> x<-sample(c("Male","Female"),30,replace=TRUE)
> y<-rnorm(30)
> grp<-sample(letters[1:3],30,replace=TRUE)
> df<-data.frame(x,y,grp)
> df
Output
       x              y  grp
1 Female    0.790349405    b
2   Male    0.868186299    b
3 Female   -2.108607808    b
4 Female    0.284872060    c
5   Male   -1.128470452    b
6   Male    0.001181183    b
7 Female   -2.915847134    c
8   Male   -1.416607857    c
9 Female   -1.784574028    a
10  Male    0.685830764    a
11 Female   0.581216168    c
12   Male   0.387109500    c
13 Female   0.611448059    c
14 Female   0.603614728    c
15   Male   0.207989975    c
16   Male   0.357018523    b
17 Female  -0.196608618    c
18   Male   1.165436068    c
19   Male   0.466733550    c
20 Female  -1.293515169    b
21   Male  -1.046339186    b
22 Female   1.692938740    c
23 Female   1.360998968    a
24 Female  -0.141122217    c
25   Male  -0.946920446    a
26 Female   1.091516275    c
27   Male   0.216101163    a
28 Female   0.935390544    a
29   Male  -0.636606941    a
30 Female   0.266238867    b
Loading ggplot2 and creating the boxplot −
> library(ggplot2)
> ggplot(df,aes(x,y))+geom_boxplot(aes(fill=grp))
Output

Updated on: 2026-03-11T22:50:56+05:30
5K+ Views

Advertisements