
Article Categories
- All Categories
-
 Data Structure
-
 Networking
-
 RDBMS
RDBMS
-
 Operating System
-
 Java
Java
-
 MS Excel
-
 iOS
iOS
-
 HTML
HTML
-
 CSS
CSS
-
 Android
-
 Python
-
 C Programming
-
 C++
C++
-
 C#
C#
-
 MongoDB
-
 MySQL
MySQL
-
 Javascript
-
 PHP
PHP
-
 Economics & Finance
Create histogram with horizontal boxplot on top in base R.
To create a histogram with horizontal boxplot on top in base R, we first need to define the layout of the plotting area with layout function and par function margin (mar) then the boxplot will be created and after that the histogram will be created. While creating the boxplot and histogram we need to make sure that the ylim for boxplot and xlim for histogram are same.
Check out the below Example to understand how it can be done.
Example
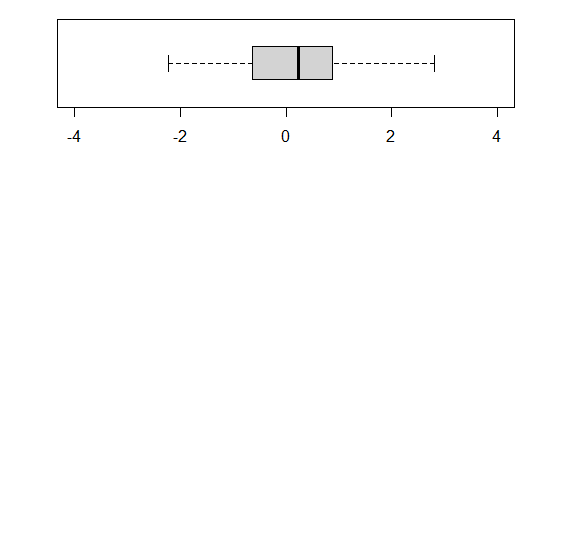
To create a histogram with horizontal boxplot on top in base R, use the following snippet −
xOutput
If you execute the above given snippet, it generates the following Output −
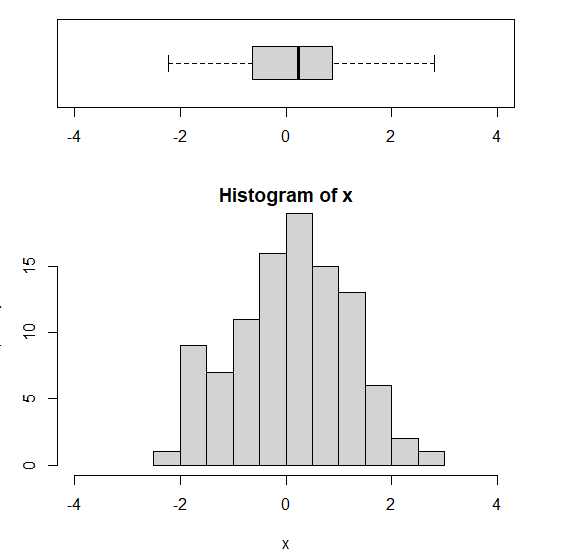
To create a histogram with horizontal boxplot on top in base R add the following code to the above snippet −
xOutput
If you execute all the above given snippets as a single program, it generates the following Output −

804 Views
