
Article Categories
- All Categories
-
 Data Structure
-
 Networking
-
 RDBMS
RDBMS
-
 Operating System
-
 Java
Java
-
 MS Excel
-
 iOS
iOS
-
 HTML
HTML
-
 CSS
CSS
-
 Android
-
 Python
-
 C Programming
-
 C++
C++
-
 C#
C#
-
 MongoDB
-
 MySQL
MySQL
-
 Javascript
-
 PHP
PHP
-
 Economics & Finance
Selected Reading
How to create horizontal lines with two different colors after a threshold in R?
To create two horizontal lines with different color after a threshold in R, we can follow the below steps −
- First of all, create a plot in base R.
- Then, add a line to the plot using abline function.
- After that, use segments function to partially change the color of the line.
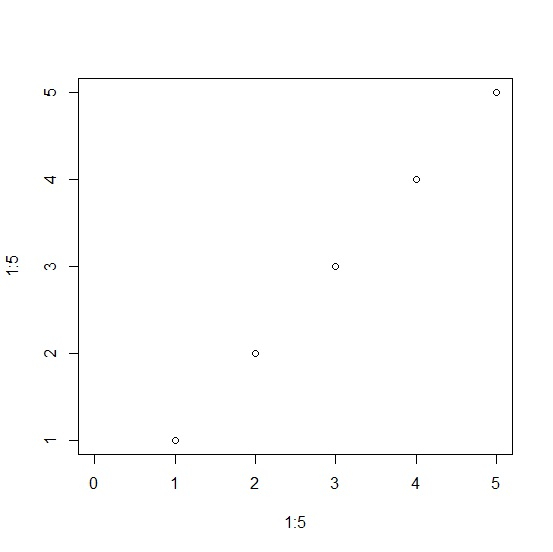
Create the plot
Using plot function to create a plot in base R −
plot(1:5,1:5,xlim=c(0,5))
Output
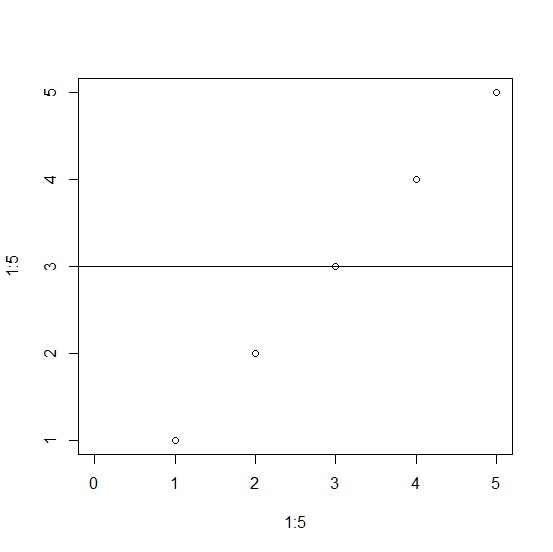
Add a line to the plot
Using abline function to add a line to the plot −
plot(1:5,1:5,xlim=c(0,5))
abline(h=3)
Output
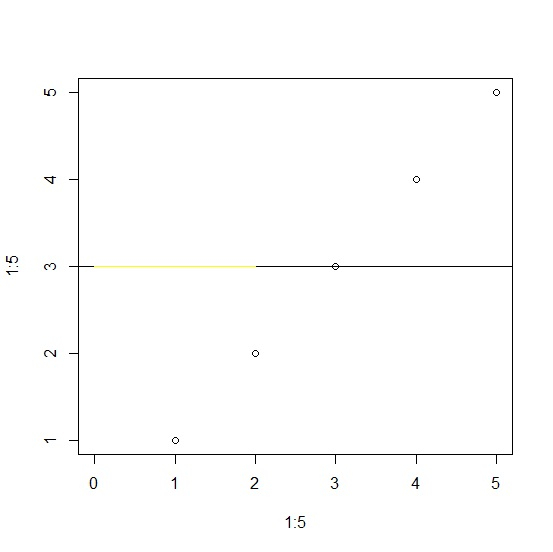
Partially color the line
Using segments function to color the with yellow color starting from 0 to 3 −
plot(1:5,1:5,xlim=c(0,5))
abline(h=3)
segments(x0=0,y0=3,x1=2,y1=3,col="yellow")
Output

Updated on: 2026-03-11T22:50:58+05:30
498 Views

Advertisements