
Article Categories
- All Categories
-
 Data Structure
-
 Networking
-
 RDBMS
RDBMS
-
 Operating System
-
 Java
Java
-
 MS Excel
-
 iOS
iOS
-
 HTML
HTML
-
 CSS
CSS
-
 Android
-
 Python
-
 C Programming
-
 C++
C++
-
 C#
C#
-
 MongoDB
-
 MySQL
MySQL
-
 Javascript
-
 PHP
PHP
-
 Economics & Finance
Selected Reading
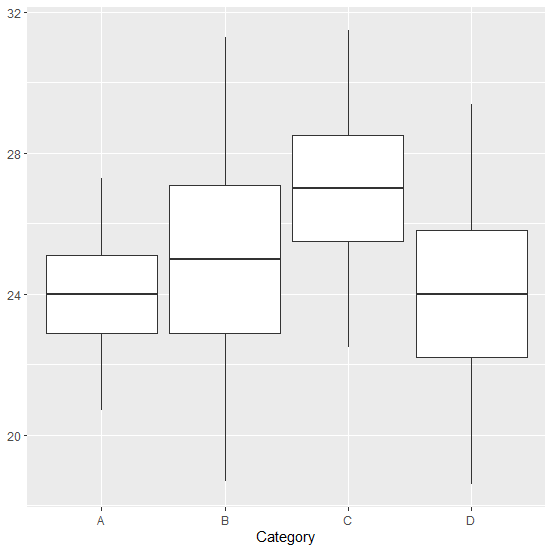
How to create boxplot using mean and standard deviation in R?
The main statistical parameters that are used to create a boxplot are mean and standard deviation but in general, the boxplot is created with the whole data instead of these values. If we don’t have whole data but mean and standard deviation are available then the boxplot can be created by finding all the limits of a boxplot using mean as a measure of central tendency.
Example
Consider the below data frame:
> df<-data.frame(mean=c(24,25,27,24),sd=c(1.1,2.1,1.5,1.8),Category=as.factor(c("A","B","C","D")))
> df
Output
mean sd Category
1 24 1.1 A
2 25 2.1 B
3 27 1.5 C
4 24 1.8 D
Loading ggplot2 package and creating the boxplot of each category in df:
Example
> library(ggplot2)
> ggplot(df,aes(x=Category))+geom_boxplot(aes(lower=mean-sd,upper=mean+sd,middle=mean,ymin=mean-3*sd,ymax=mean+3*sd),stat="identity")
Output:

Updated on: 2026-03-11T22:50:53+05:30
10K+ Views

Advertisements