
Article Categories
- All Categories
-
 Data Structure
-
 Networking
-
 RDBMS
RDBMS
-
 Operating System
-
 Java
Java
-
 MS Excel
-
 iOS
iOS
-
 HTML
HTML
-
 CSS
CSS
-
 Android
-
 Python
-
 C Programming
-
 C++
C++
-
 C#
C#
-
 MongoDB
-
 MySQL
MySQL
-
 Javascript
-
 PHP
PHP
-
 Economics & Finance
Selected Reading
How to create horizontal lines for each bar in a bar plot of base R?
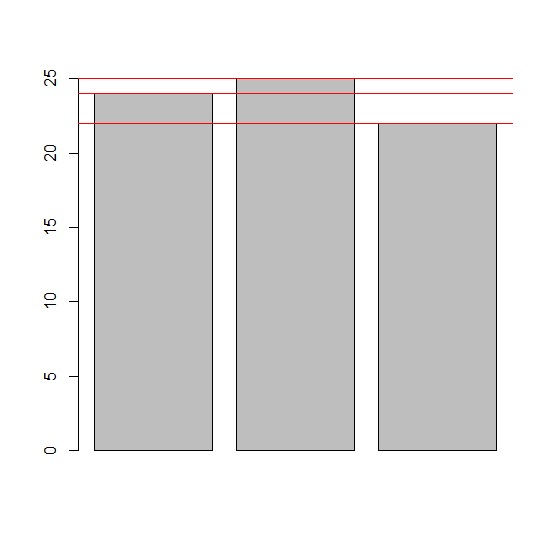
To create horizontal lines for each bar in a bar plot of base R, we can use abline function and pass the same values as in the original barplot with h argument that represents horizontal with different color to make the plot a little better in terms of visualization.
Example
x<-c(24,25,22)
barplot(x)
abline(h=c(24,25,22),col="red")
Output
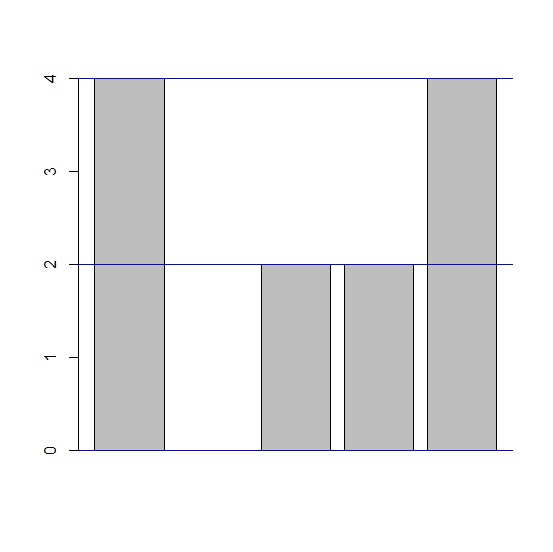
Example2
y<-rpois(5,2)
y
Output
[1] 4 0 2 2 4
Example
barplot(y)
abline(h=c(4,0,2,2,4),col="blue")
Output

Updated on: 2026-03-11T22:50:56+05:30
2K+ Views

Advertisements