
Article Categories
- All Categories
-
 Data Structure
-
 Networking
-
 RDBMS
RDBMS
-
 Operating System
-
 Java
Java
-
 MS Excel
-
 iOS
iOS
-
 HTML
HTML
-
 CSS
CSS
-
 Android
-
 Python
-
 C Programming
-
 C++
C++
-
 C#
C#
-
 MongoDB
-
 MySQL
MySQL
-
 Javascript
-
 PHP
PHP
-
 Economics & Finance
Selected Reading
How to create horizontal histogram in R?
Generally, the histogram is a graph that is displayed in vertical form and it helps us to analyze the distribution of a variable, mainly to understand whether the distribution is normal or not. The horizontal histogram can be also created by using coord_flip function of ggplot2 package. Check out the below example to understand how it works.
Example
Consider the below data frame.
> x<-rnorm(10000,5,0.97)
> df<-data.frame(x)
> head(df,20)
Output
x
1 3.509446
2 5.075813
3 5.242884
4 5.236765
5 5.775746
6 5.331167
7 5.250956
8 5.925262
9 6.102322
10 4.045241
11 4.117635
12 4.137581
13 4.758140
14 5.311225
15 4.354592
16 4.021351
17 5.330966
18 5.376746
19 6.717059
20 5.206282
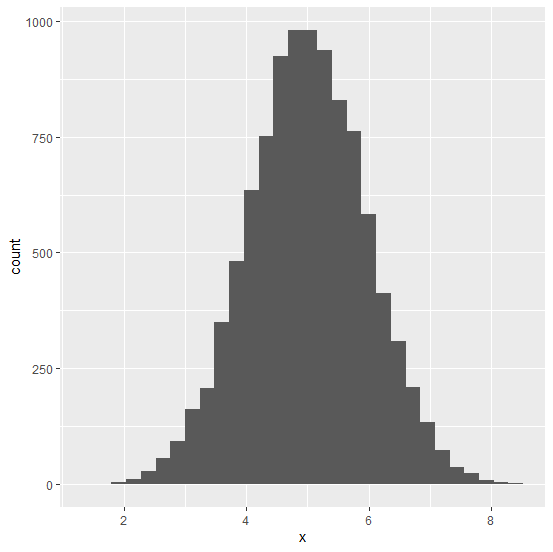
Loading ggplot2 package and creating histogram of x:
> library(ggplot2)
> ggplot(df,aes(x))+geom_histogram(bins=30)
Output
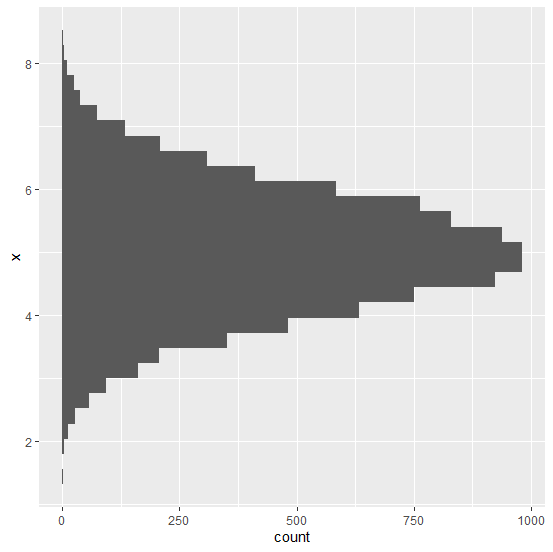
Creating horizontal histogram of x.
> ggplot(df,aes(x))+geom_histogram(bins=30)+coord_flip()
Output:

Updated on: 2026-03-11T22:50:53+05:30
2K+ Views

Advertisements