
Article Categories
- All Categories
-
 Data Structure
-
 Networking
-
 RDBMS
RDBMS
-
 Operating System
-
 Java
Java
-
 MS Excel
-
 iOS
iOS
-
 HTML
HTML
-
 CSS
CSS
-
 Android
-
 Python
-
 C Programming
-
 C++
C++
-
 C#
C#
-
 MongoDB
-
 MySQL
MySQL
-
 Javascript
-
 PHP
PHP
-
 Economics & Finance
Selected Reading
How to create boxplot in base R with higher width of the box lines?
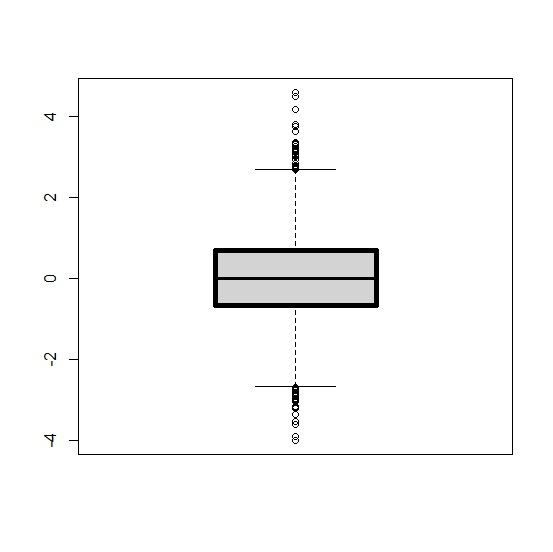
To create boxplot in base R with higher width of the box lines, we can use the boxlwd argument inside boxplot function. For example, if we have a vector called x then we can create the boxplot with higher width of the box lines using the command −
boxplot(x,boxlwd=5)
Example
x<-rnorm(10000)
boxplot(x,boxlwd=5)
Output
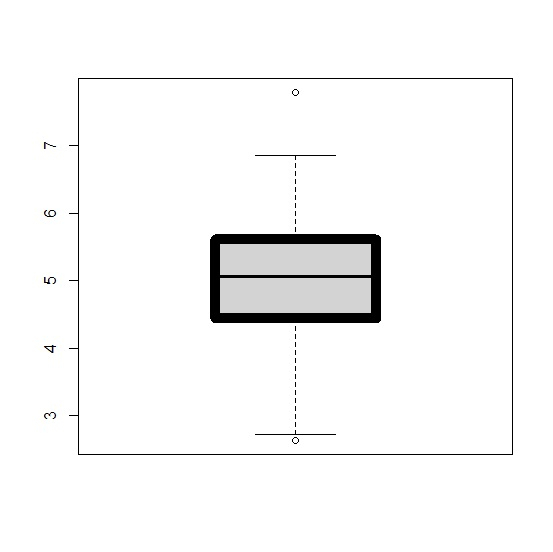
Example
y<-rnorm(100,5,1)
boxplot(y,boxlwd=10)
Output

Updated on: 2026-03-11T22:50:56+05:30
303 Views

Advertisements