
Article Categories
- All Categories
-
 Data Structure
-
 Networking
-
 RDBMS
RDBMS
-
 Operating System
-
 Java
Java
-
 MS Excel
-
 iOS
iOS
-
 HTML
HTML
-
 CSS
CSS
-
 Android
-
 Python
-
 C Programming
-
 C++
C++
-
 C#
C#
-
 MongoDB
-
 MySQL
MySQL
-
 Javascript
-
 PHP
PHP
-
 Economics & Finance
Selected Reading
How to create boxplot for list elements using ggplot2 in R?
If list elements are of equal size having numerical values then the boxplot for each element can be created by using ggplot2 but before creating the boxplot we would need to convert the list to a data frame. The conversion of list elements to a data frame will be done by unlisting of elements and creating two columns, one for categories and one for response variable. Check out the below example to understand how it works.
Consider the below list −
Example
List<-list(x1=rnorm(50),x2=rnorm(50,5,2.25),x3=rpois(20,5),x4=rexp(50,2.24))
List
Output
$x1
[1]  -1.176031956  0.579913079  0.096926262 -0.427232058 -0.198030503
[6]   1.841913493 -0.393699412 -0.741053003  1.630058628 -0.130636957
[11]  1.364896244 -0.110390408 -0.627744695 -1.067081984  1.092412978
[16]  0.320356204  0.487544839 -1.006339944  0.093506416  0.859863694
[21] -0.020128645  0.891132545  0.941056586 -0.695571470  0.558748254
[26] -0.253115911 -2.132165899 -0.581100035  0.812265615  0.203675036
[31] -1.392503777  0.886986339  0.007244105 -0.697595223  0.528936991
[36] -2.184316458 -0.724110556 -0.825239253 -0.030541553 -1.206632275
[41]  0.923561087 -1.570654178  1.036751033  1.526233129  0.001034865
[46]  0.443434709 -0.850936789 -0.011010215  0.540192391  0.038736810
$x2
[1]  6.088891889 4.623569932 1.834276180 2.933849522 2.765800908
[6]  3.854603131 8.501424832 6.445729700 6.323306555 2.675450491
[11] -0.002243743 6.398865644 4.521469383 4.361939039 9.093269110
[16] 3.671982997 5.514441938 5.959552698 2.738940227 4.260632034
[21] 2.259058277 4.144724227 5.491621003 7.653174009 3.002646858
[26] 3.289787012 5.811569268 6.734721611 8.670754866 6.862465363
[31] 3.638609589 4.281486708 3.578459145 5.033395896 3.695496406
[36] 6.112623764 6.312282919 5.570214544 6.826339082 5.992488470
[41] 4.682329414 8.187218628 1.062620127 2.276892850 8.293078426
[46] 5.363264442 2.103595353 7.230079630 2.550299513 -0.194524841
$x3
[1] 8 2 4 7 3 3 2 4 3 9 7 6 5 3 4 2 6 5 2 5
$x4
[1] 0.65147281 1.74594826 0.65233034 0.40294032 0.38165284 0.39205974
[7] 0.33521817 0.15633428 0.28280908 0.09549913 0.54823098 0.06267592
[13] 0.28240212 0.19090267 0.70199549 0.48913729 0.28641656 0.81875338
[19] 0.08596022 0.14941045 1.39130210 0.17543930 0.53338602 0.13499678
[25] 0.81532856 0.59359118 0.68001094 0.36248314 0.14710899 0.96465429
[31] 0.10055140 0.95873320 0.58383093 0.03503158 0.08109495 0.96238620
[37] 1.01943749 0.30264786 0.11048677 0.05480666 0.39600577 0.49345382
[43] 0.03802792 1.46820164 0.08705596 0.00969041 0.12558671 0.08916259
[49] 0.05486721 0.19811754
Converting the list to a data frame called df −
df<-data.frame(List=unlist(List),Group=rep(c("x1","x2","x3","x4"),times=c(50,50,20,50)))
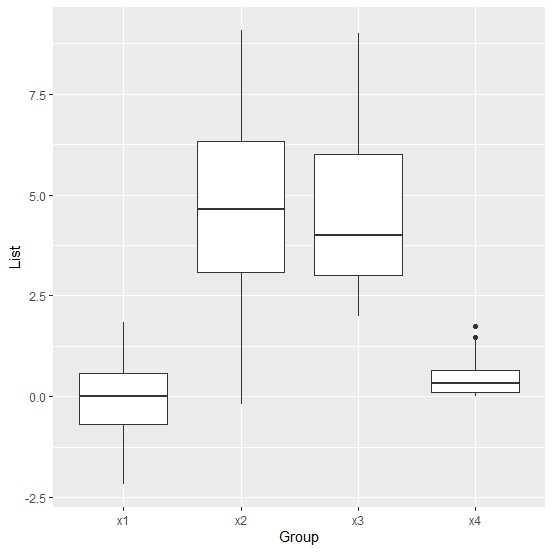
Loading ggplot2 package and creating the boxplot −
Example
library(ggplot2)
ggplot(df,aes(Group,List))+geom_boxplot()
Output

Updated on: 2026-03-11T22:50:55+05:30
788 Views

Advertisements