
Article Categories
- All Categories
-
 Data Structure
-
 Networking
-
 RDBMS
RDBMS
-
 Operating System
-
 Java
Java
-
 MS Excel
-
 iOS
iOS
-
 HTML
HTML
-
 CSS
CSS
-
 Android
-
 Python
-
 C Programming
-
 C++
C++
-
 C#
C#
-
 MongoDB
-
 MySQL
MySQL
-
 Javascript
-
 PHP
PHP
-
 Economics & Finance
Selected Reading
How to create boxplot for a list object in base R?
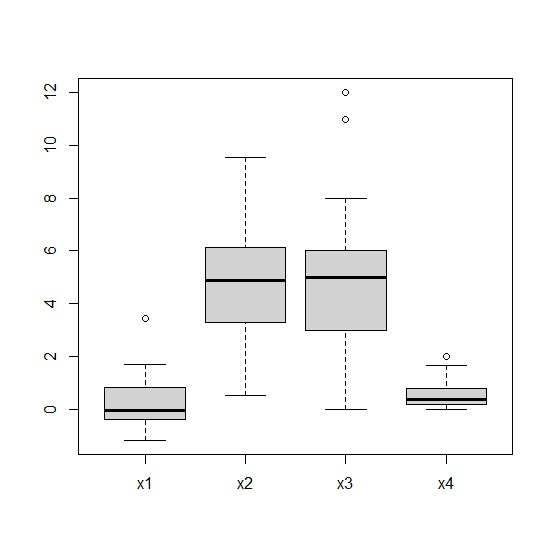
A list object can contain multiple elements of data, also the size of the data may vary. If a list object has numerical vectors then the boxplot for each of the elements can be created simply by using boxplot function. For example, if we have a list object called LIST that contains five numerical vectors then the boxplot for each of the vectors can be created by using the command boxplot(LIST)
Example
List<-list(x1=rnorm(50),x2=rnorm(50,5,2.25),x3=rpois(20,5),x4=rexp(50,2.24))
List
Output
$x1
[1]  0.47673123  -0.13988530 -0.03454116 -1.07172674 -0.07038959  0.84246745
[7] -0.24880770  -0.16358068  0.58943824 -0.02419312  1.23205397  0.41819088
[13] -0.18096917 -0.66329446  0.59654575 -0.38813742  0.11389223  0.34736194
[19] -1.02731203 -1.00254775 -0.12265414 -0.26374874  0.70882415  0.94992258
[25]  0.94381547 -0.96601086  0.64740016  1.11793512  1.17730331  1.71042415
[31] -0.41691694 -0.96920255  0.41512216  1.26071518 -0.14539137 -1.16879555
[37]  1.38377334  3.45037406  1.35805370  0.47444658 -0.49433200 -0.36656357
[43] -0.21815763 -0.74840666  0.26719190  1.20493116  1.60986589 -0.60518029
[49] -0.41968672 -0.32073967
$x2
[1]  5.8796314 5.7298751 5.3845408 3.1797638 4.7799172 6.9741100 7.9921069
[8]  9.5581477 2.2260415 1.0497262 4.2621598 3.3089075 4.8928650 7.3186556
[15] 4.9003319 5.3323320 6.5852322 2.6108129 5.5484016 3.1658888 5.5651849
[22] 3.9454364 1.2637536 3.1110510 0.5324844 5.9578925 8.1218069 2.9446954
[29] 8.5903533 5.5571433 0.5557869 5.0468930 3.9626768 3.4359655 2.1267040
[36] 5.3730887 3.4845970 6.1972562 2.9490418 4.0302330 7.4539694 6.6024379
[43] 6.4314803 3.6497954 3.3413132 6.1229056 3.5588145 6.1242543 3.5965840
[50] 8.6095519
$x3
[1] 2 0 8 5 2 3 6 4 5 11 6 6 7 3 6 3 4 12 6 5
$x4
[1]  0.585750982 0.370122795 1.987015464 0.024077675 0.032587786 0.997293306
[7]  0.130429262 0.422050875 0.348886654 0.106149101 1.439493919 0.105526681
[13] 0.609840540 0.196605252 0.671462334 0.196896603 0.265777491 0.987109188
[19] 0.177649340 0.310512653 0.169546605 0.356390141 1.055593510 0.401508889
[25] 0.785761516 0.430135796 0.274123388 0.823727150 0.613929177 0.264846348
[31] 0.904656444 0.089555490 0.110510149 0.461548606 0.017619161 1.007491679
[37] 0.329095102 0.338861211 0.004771366 0.861360820 0.059209099 1.097892124
[43] 0.071317813 0.372330993 0.168262454 0.562485840 0.465475293 0.287788140
[49] 1.282085210 1.655309706
Example
boxplot(List)
Output

Updated on: 2026-03-11T22:50:55+05:30
1K+ Views

Advertisements