- Trending Categories
Data Structure
Networking
RDBMS
Operating System
Java
MS Excel
iOS
HTML
CSS
Android
Python
C Programming
C++
C#
MongoDB
MySQL
Javascript
PHP
Physics
Chemistry
Biology
Mathematics
English
Economics
Psychology
Social Studies
Fashion Studies
Legal Studies
- Selected Reading
- UPSC IAS Exams Notes
- Developer's Best Practices
- Questions and Answers
- Effective Resume Writing
- HR Interview Questions
- Computer Glossary
- Who is Who
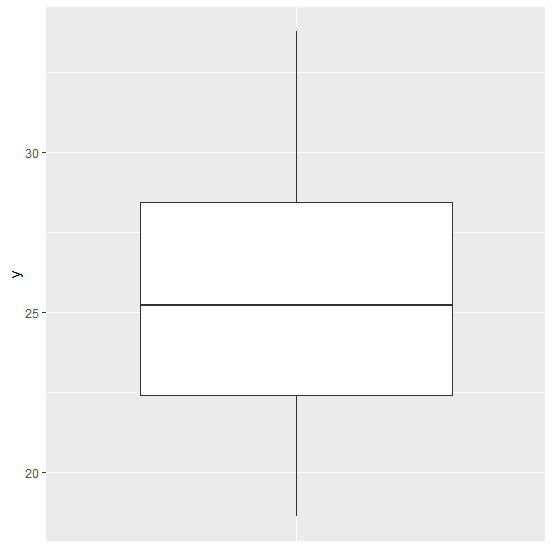
How to create a boxplot using ggplot2 for single variable without X-axis labels in R?
The important part of a boxplot is Y−axis because it helps to understand the variability in the data and hence, we can remove X−axis labels if we know the data description. To create a boxplot using ggplot2 for single variable without X−axis labels, we can use theme function and set the X−axis labels to blank as shown in the below example.
Example
Consider the below data frame −
y<−rnorm(20,25,4.2) df<−data.frame(y) df
Output
y 1 30.52520 2 23.95832 3 25.47747 4 28.13632 5 33.78174 6 18.61764 7 20.46791 8 29.65309 9 22.46586 10 19.87244 11 22.32916 12 26.26577 13 30.54542 14 27.85693 15 23.60995 16 19.79125 17 27.01937 18 22.43575 19 29.34608 20 24.97311
Loading ggplot2 package and creating a boxplot of x −
Example
library(ggplot2) ggplot(df,aes(x=factor(0),y))+geom_boxplot()
Output
Creating the boxplot without X-axis labels −
Example
ggplot(df,aes(x=factor(0),y))+geom_boxplot()+theme(axis.title.x=element_blank(),axis.text.x=element_blank(),axis.ticks.x=element_blank())
Output
- Related Articles
- How to create boxplot using ggplot2 without whiskers in R?
- How to create a dendrogram without X-axis labels in R?
- How to display positive sign for X-axis labels in R using ggplot2?
- How to create boxplot using ggplot2 without box border in R?
- How to create boxplot in base R without axes labels?
- How to change the X-axis labels for boxplots created by using boxplot function in R?
- How to create boxplot for list elements using ggplot2 in R?
- How to increase the X-axis labels font size using ggplot2 in R?
- How to change ordinal X-axis label to text labels using ggplot2 in R?
- How to create a boxplot using ggplot2 with aes_string in R?
- How to X-axis labels to the top of the plot using ggplot2 in R?
- How to reverse the X-axis labels of scatterplot created by using ggplot2 in R?
- How to change the Y axis limit for boxplot created by using ggplot2 in R?
- How to set the X-axis labels in histogram using ggplot2 at the center in R?
- How to create a bar graph using ggplot2 without horizontal gridlines and Y-axes labels in R?

Advertisements