
Article Categories
- All Categories
-
 Data Structure
-
 Networking
-
 RDBMS
RDBMS
-
 Operating System
-
 Java
Java
-
 MS Excel
-
 iOS
iOS
-
 HTML
HTML
-
 CSS
CSS
-
 Android
-
 Python
-
 C Programming
-
 C++
C++
-
 C#
C#
-
 MongoDB
-
 MySQL
MySQL
-
 Javascript
-
 PHP
PHP
-
 Economics & Finance
Selected Reading
How to change the order of boxplot by means using ggplot2 in R?
To change the order of boxplot by means using ggplot2, we can use reorder function inside aes of ggplot. For example, if we have a data frame called df that contains two columns say x (categorical) and y(count) then the boxplot ordered by means can be created by using the command ggplot(df,aes(x=reorder(x,y,mean),y))+geom_boxplot()
Example
Consider the below data frame −
> x<-c(rep(c("A","B","C"),times=c(10,5,5)))
> y<-c(rpois(10,25),rpois(5,10),rpois(5,2))
> df<-data.frame(x,y)
> df
Output
<p>   x  y
1  A 22
2  A 17
3  A 20
4  A 36
5  A 34
6  A 25
7  A 25
8  A 30
9  A 23
10 A 29
11 B  8
12 B  8
13 B  6
14 B  8
15 B 12
16 C  0
17 C  4
18 C  3
19 C  2
20 C  1</p>
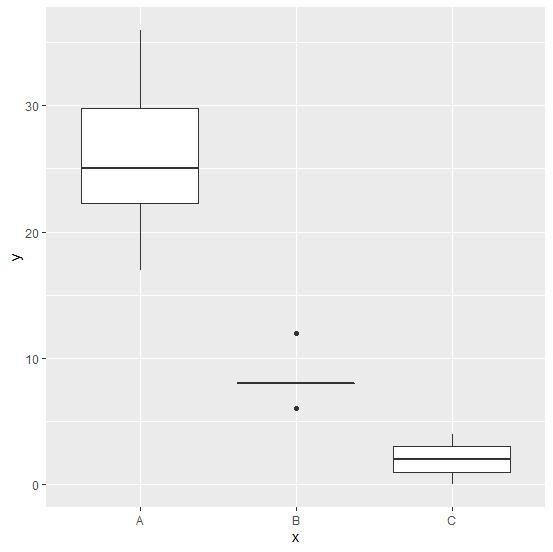
Loading ggplot2 package and creating boxplot for categories in x −
> library(ggplot2)
> ggplot(df,aes(x,y))+geom_boxplot()
Output
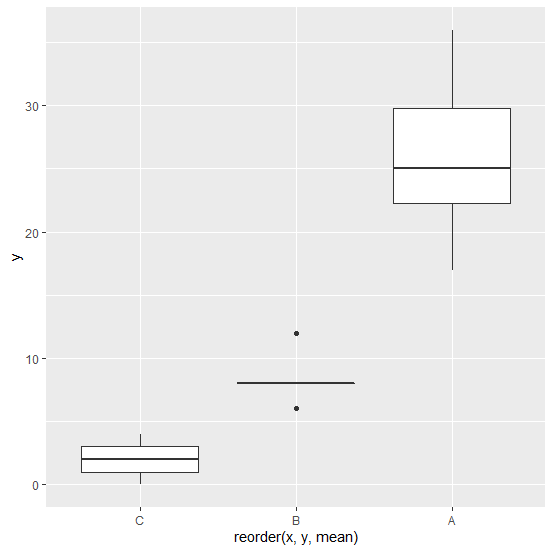
Creating boxplot for categories in x ordered by mean of y −
> ggplot(df,aes(x=reorder(x,y,mean),y))+geom_boxplot()
Output

Updated on: 2026-03-11T22:50:56+05:30
991 Views

Advertisements