
Article Categories
- All Categories
-
 Data Structure
-
 Networking
-
 RDBMS
RDBMS
-
 Operating System
-
 Java
Java
-
 MS Excel
-
 iOS
iOS
-
 HTML
HTML
-
 CSS
CSS
-
 Android
-
 Python
-
 C Programming
-
 C++
C++
-
 C#
C#
-
 MongoDB
-
 MySQL
MySQL
-
 Javascript
-
 PHP
PHP
-
 Economics & Finance
Selected Reading
How to create boxplot using ggplot2 without box border in R?
We know that the middle portion of a boxplot is a box which is covered with black border but we can remove that border from the plot by defining the aesthetics of the boxplot with color argument. We can follow the below steps to create such type of boxplot −
- Creating a data frame.
- Then create a default boxplot.
- Loading ggplot2 package and creating the same boxplot without box border.
Create the data frame
Let's create a data frame as shown below −
x<-sample(LETTERS[1:4],20,replace=TRUE)
y<-rnorm(20)
grp<-sample(c("Male","Female"),20,replace=TRUE)
df<-data.frame(x,y,grp)
df
On executing, the above script generates the below output(this output will vary on your system due to randomization) −
  x       y     grp
1 C -2.03011561 Male
2 A -0.11006189 Female
3 D 1.14021182  Female
4 A 0.13282948  Male
5 C 1.24059685  Female
6 A -0.64027706 Female
7 D 2.69644400  Male
8 B -0.16214751 Male
9 C -0.57809399 Female
10 B 1.13308146 Female
11 A 0.09518827 Female
12 D -0.49467890 Female
13 C -2.07383434 Male
14 A 0.48415726  Male
15 C -0.85017870 Female
16 B -1.39666444 Female
17 A 1.61422362  Male
18 C 0.44615237  Male
19 D -1.35304529 Female
20 C -0.56352488 Male
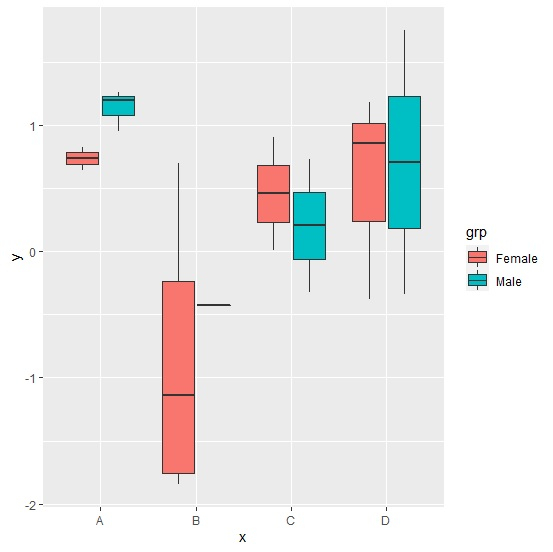
Creating the default boxplot
Loading ggplot2 package and creating the boxplot for categories in grp column −
x<-sample(LETTERS[1:4],20,replace=TRUE)
y<-rnorm(20)
grp<-sample(c("Male","Female"),20,replace=TRUE)
library(ggplot2)
ggplot(df,aes(x,y,fill=grp))+geom_boxplot()
Output
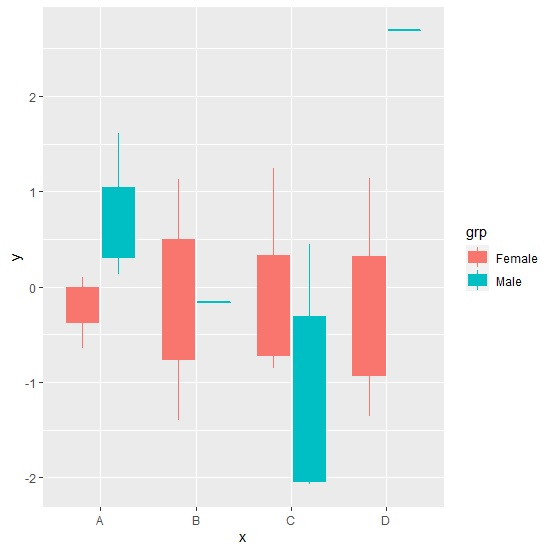
Creating the boxplot without box border
Creating the boxplot for categories in grp column without box border−
x<-sample(LETTERS[1:4],20,replace=TRUE)
y<-rnorm(20)
grp<-sample(c("Male","Female"),20,replace=TRUE)
library(ggplot2)
ggplot(df,aes(x,y,fill=grp))+geom_boxplot()+geom_boxplot(aes(color=grp))
Output

Updated on: 2026-03-11T22:50:58+05:30
2K+ Views

Advertisements