
Article Categories
- All Categories
-
 Data Structure
-
 Networking
-
 RDBMS
RDBMS
-
 Operating System
-
 Java
Java
-
 MS Excel
-
 iOS
iOS
-
 HTML
HTML
-
 CSS
CSS
-
 Android
-
 Python
-
 C Programming
-
 C++
C++
-
 C#
C#
-
 MongoDB
-
 MySQL
MySQL
-
 Javascript
-
 PHP
PHP
-
 Economics & Finance
Selected Reading
How to create boxplot using ggplot2 without whiskers in R?
To create boxplot using ggplot2 without whiskers, we need to use coef argument inside geom_boxplot function. For example, if we have data frame called df and there exists one categorical variable x and one response variable y then the boxplots for categories without whiskers can be created by using ggplot(df,aes(x,y))+geom_boxplot(coef=0).
Consider the below data frame −
Example
x<-sample(c("Male","Female"),20,replace=TRUE)
y<-rnorm(20,514,26.3)
df<-data.frame(x,y)
df
Output
     x         y
1  Male     524.2809
2  Male     537.9061
3  Male     553.8109
4  Male     523.5075
5  Male     506.7074
6  Male     437.4206
7  Male     512.1295
8  Female   489.4892
9  Female   553.5411
10  Male    504.8551
11  Male    538.9155
12  Female  520.4593
13  Female  534.6099
14  Female  529.9515
15  Female  550.9238
16  Male    506.9946
17  Male    510.3780
18  Male    469.4754
19  Female  554.1829
20  Male    460.4412
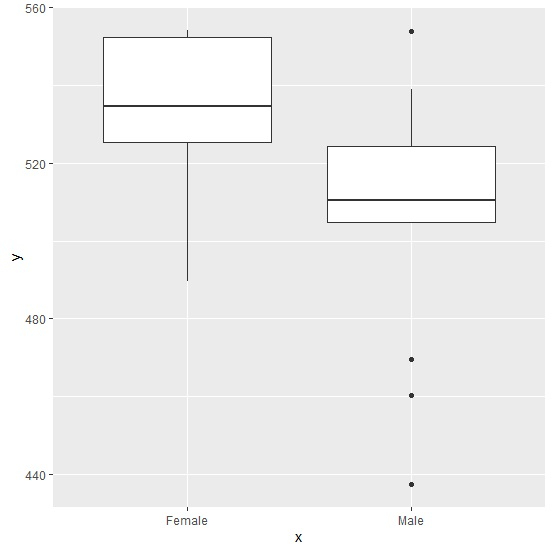
Loading ggplot2 package and creating boxplots for categories in x −
Example
library(ggplot2)
ggplot(df,aes(x,y))+geom_boxplot()
Output
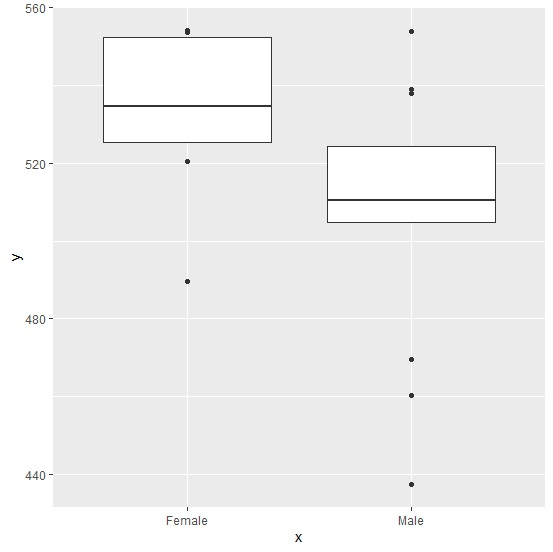
Creating boxplots for categories in x without whiskers −
Example
ggplot(df,aes(x,y))+geom_boxplot(coef=0)
Output

Updated on: 2026-03-11T22:50:55+05:30
1K+ Views

Advertisements