
Article Categories
- All Categories
-
 Data Structure
-
 Networking
-
 RDBMS
RDBMS
-
 Operating System
-
 Java
Java
-
 MS Excel
-
 iOS
iOS
-
 HTML
HTML
-
 CSS
CSS
-
 Android
-
 Python
-
 C Programming
-
 C++
C++
-
 C#
C#
-
 MongoDB
-
 MySQL
MySQL
-
 Javascript
-
 PHP
PHP
-
 Economics & Finance
Selected Reading
How to create boxplot for matrix columns in R?
To create a boxplot for data frame columns we can simply use boxplot function but it cannot be done directly for matrix columns. If we want to create boxplot for matrix columns then we need to convert the matrix into data frame and then use the boxplot function. For example, if we have a matrix called M then the boxplot for columns in M can be created by using boxplot(as.data.frame(M)).
Example
> M<-matrix(rnorm(150,2,0.35),ncol=5)
> M
Output
[,1] [,2] [,3] [,4] [,5]
[1,] 1.688556 1.697216 1.9469573 1.873956 2.010246
[2,] 1.655357 1.927145 2.0937415 2.273638 1.966972
[3,] 1.886917 1.182852 2.0291452 2.507944 2.338664
[4,] 2.013053 1.995526 1.8122830 2.531708 2.483359
[5,] 1.812015 1.950053 1.8902859 2.453222 2.123253
[6,] 1.781764 1.786285 2.3384120 2.275382 2.509708
[7,] 1.836378 1.192781 1.5382031 2.012324 2.290340
[8,] 2.061482 1.705481 2.5542404 1.958202 1.991252
[9,] 2.162214 1.958862 1.8096081 1.810033 1.856942
[10,] 1.897020 1.614834 2.3407207 2.199068 1.807968
[11,] 2.491147 2.317192 2.4486029 2.131722 1.947841
[12,] 1.860307 1.932982 2.2034280 1.982581 2.720482
[13,] 1.814205 2.214286 1.6917036 1.854341 2.150684
[14,] 1.224437 1.800944 1.7600398 1.503382 2.775012
[15,] 2.309462 2.534766 1.5111472 2.058761 1.823550
[16,] 2.190564 1.588298 1.8854163 1.694651 1.939035
[17,] 2.521611 2.339012 2.2959581 2.501148 1.951673
[18,] 1.808799 2.314207 1.8704730 1.937851 1.877917
[19,] 2.476626 1.806194 2.7111663 2.156506 1.521197
[20,] 1.819725 1.633549 1.9438948 2.213533 2.247944
[21,] 2.412117 1.797531 2.5320892 1.889267 2.586912
[22,] 1.679395 2.276218 1.6120445 1.648766 1.889033
[23,] 2.286285 2.221312 0.9408758 1.896072 1.996449
[24,] 2.274975 2.398884 2.0146319 1.814092 2.350100
[25,] 2.106620 1.640401 1.6416454 2.452356 1.638885
[26,] 1.556329 1.706762 1.8324196 2.348518 1.593293
[27,] 2.171867 1.707615 1.9667116 2.191344 1.595531
[28,] 1.796751 2.753674 2.1741976 1.623239 2.399018
[29,] 2.635992 2.180735 2.2114669 2.258419 2.277367
[30,] 1.874671 2.113165 2.3653358 2.231705 1.919449
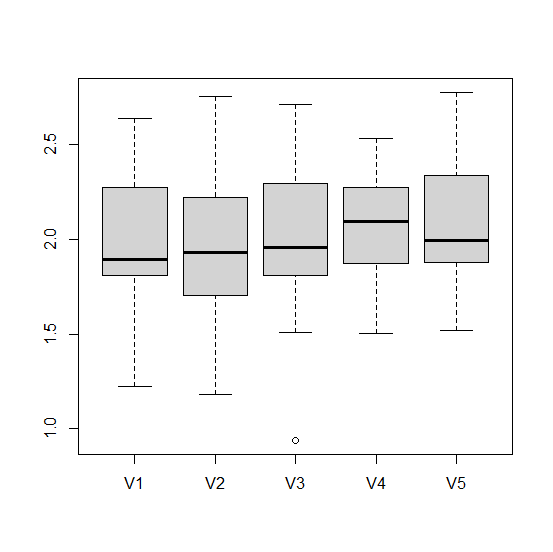
Example
> boxplot(as.data.frame(M))
Output

Updated on: 2026-03-11T22:50:54+05:30
3K+ Views

Advertisements