
Article Categories
- All Categories
-
 Data Structure
-
 Networking
-
 RDBMS
RDBMS
-
 Operating System
-
 Java
Java
-
 MS Excel
-
 iOS
iOS
-
 HTML
HTML
-
 CSS
CSS
-
 Android
-
 Python
-
 C Programming
-
 C++
C++
-
 C#
C#
-
 MongoDB
-
 MySQL
MySQL
-
 Javascript
-
 PHP
PHP
-
 Economics & Finance
Selected Reading
How to change the X-axis labels for boxplots created by using boxplot function in R?
When we create boxplots for multiple categories in R using boxplot function, by default the X-axis labels are represented by numbers. But we might want to express the categories by their name. In this situation, we can use names argument along with the boxplot function.
Consider the below vectors that represent different categories and create the boxplot for these categories −
Example
Class1<-sample(101:200,1000,replace=TRUE)
Class2<-sample(150:200,1000,replace=TRUE)
Class3<-sample(180:200,1000,replace=TRUE)
Class4<-sample(190:200,1000,replace=TRUE)
boxplot(Class1,Class2,Class3,Class4)
Output

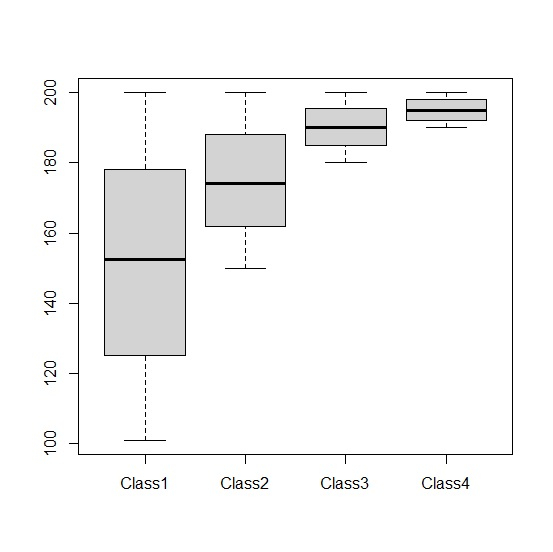
Now create the boxplot for the above categories by displaying their names on the X-axis −
Example
boxplot(Class1,Class2,Class3,Class4,names=c("Class1","Class2","Class3","Class4"))
Output
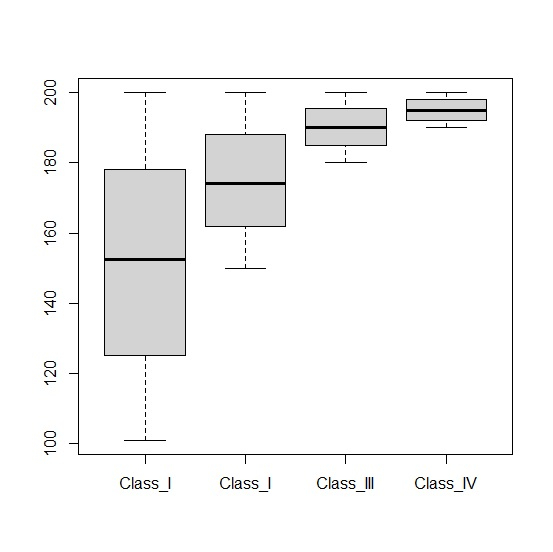
Example
boxplot(Class1,Class2,Class3,Class4,names=c("Class_I","Class_I","Class_III","Class_IV"))
Output

Updated on: 2020-10-14T12:14:30+05:30
977 Views

Advertisements