
Article Categories
- All Categories
-
 Data Structure
-
 Networking
-
 RDBMS
RDBMS
-
 Operating System
-
 Java
Java
-
 MS Excel
-
 iOS
iOS
-
 HTML
HTML
-
 CSS
CSS
-
 Android
-
 Python
-
 C Programming
-
 C++
C++
-
 C#
C#
-
 MongoDB
-
 MySQL
MySQL
-
 Javascript
-
 PHP
PHP
-
 Economics & Finance
Selected Reading
How to change ordinal X-axis label to text labels using ggplot2 in R?
A plot created with ordinal values on X-axis needs to be ordered for plotting, otherwise, the plot will have continuous values on the X-axis that includes ordinal values. If we want to convert those values to text then scale_x_discrete should be used with the number of breaks, these number of breaks are the actual number of labels we want to use in our plot.
Example
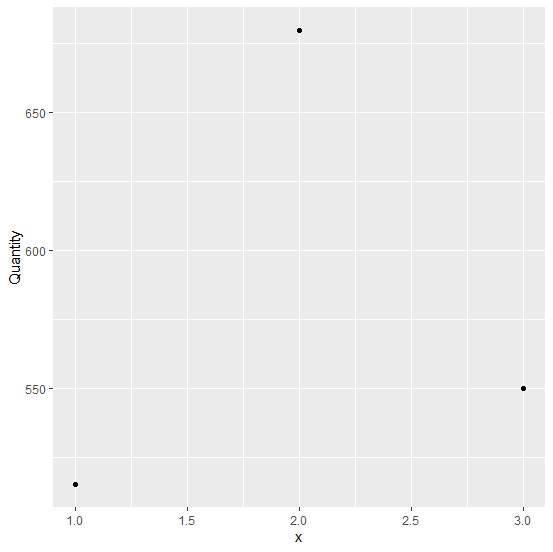
Consider the below data frame −
x<-1:3
Quantity<-c(515,680,550)
df<-data.frame(x,Quantity)
library(ggplot2)
ggplot(df,aes(x,Quantity))+geom_point()
Output
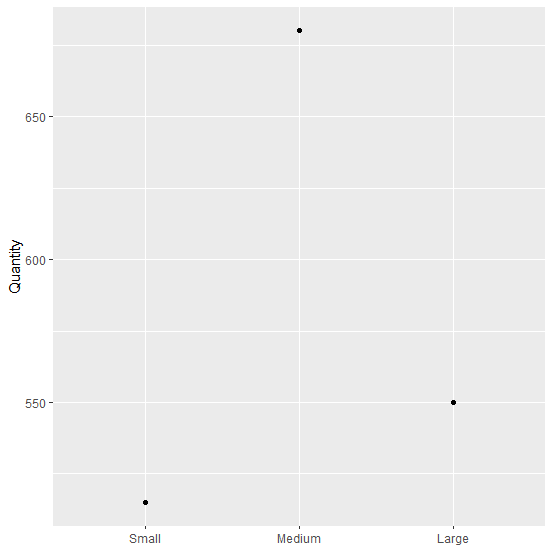
Plotting text labels on X-axis in place of numbers −
ggplot(df,aes(ordered(x),Quantity))+geom_point()+
+ scale_x_discrete(breaks = 1:3, labels=c("Small","Medium","Large"))+
+ xlab(NULL)
Output

Updated on: 2020-08-21T11:01:17+05:30
2K+ Views

Advertisements