
Article Categories
- All Categories
-
 Data Structure
-
 Networking
-
 RDBMS
RDBMS
-
 Operating System
-
 Java
Java
-
 MS Excel
-
 iOS
iOS
-
 HTML
HTML
-
 CSS
CSS
-
 Android
-
 Python
-
 C Programming
-
 C++
C++
-
 C#
C#
-
 MongoDB
-
 MySQL
MySQL
-
 Javascript
-
 PHP
PHP
-
 Economics & Finance
Selected Reading
How to create a bar chart using ggplot2 with dots drawn at the center of top edge of the bars in R?
Aesthetics is one of the most important aspect of a chart, hence we should try to use the best possible aesthetic properties in a plot. In a bar chart, we can represent the center of bars in many ways and one such way is using dots at the center of the top edge of the bars. We can use geom_point function by defining colour argument to put points at the center of top edge of the bars in a bar chart created by using ggplot2.
Example
Consider the below data frame:
> freq<-c(212,220,218)
> df<-data.frame(x,freq)
> df
Output
x freq
1 Mango 212
2 Guava 220
3 Pomegranate 218
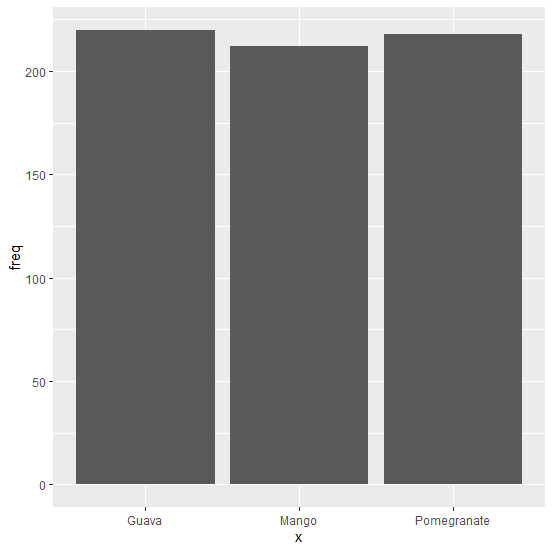
Loading ggplot2 package and creating bar chart for x:
> library(ggplot2)
> ggplot(df,aes(x,freq))+geom_bar(stat="identity")
Output:
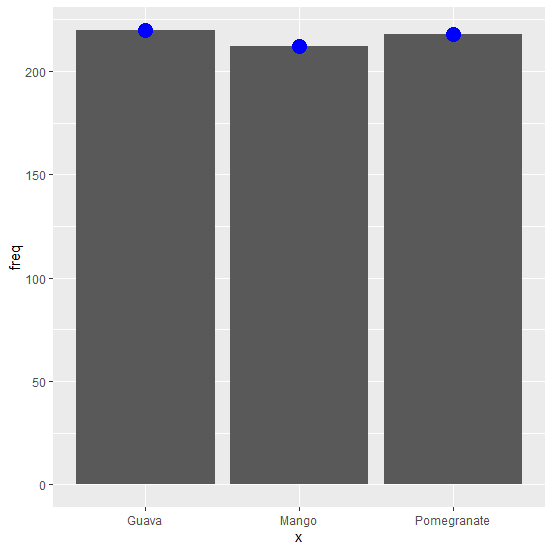
Creating bar chart with dots drawn at the center of top edge of the bars:
Example
> ggplot(df,aes(x,freq))+geom_bar(stat="identity")+geom_point(colour="blue",size=5)
Output:

Updated on: 2020-11-07T07:30:58+05:30
674 Views

Advertisements