
Article Categories
- All Categories
-
 Data Structure
-
 Networking
-
 RDBMS
RDBMS
-
 Operating System
-
 Java
Java
-
 MS Excel
-
 iOS
iOS
-
 HTML
HTML
-
 CSS
CSS
-
 Android
-
 Python
-
 C Programming
-
 C++
C++
-
 C#
C#
-
 MongoDB
-
 MySQL
MySQL
-
 Javascript
-
 PHP
PHP
-
 Economics & Finance
Selected Reading
How to change the order of bars in bar chart in R?
This can be done by setting the levels of the variable in the order we want.
Example
> data <- data.frame(Class=c("Highschool","Highschool","Graduate","Graduate",
"Graduate","Graduate","Masters","Masters","Masters","PhD"))
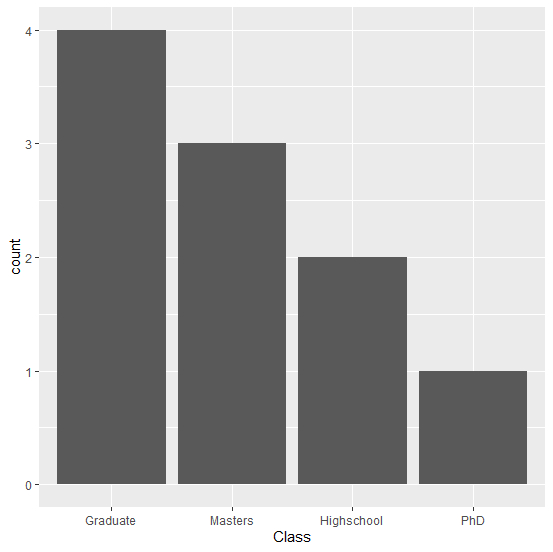
Setting the levels in decreasing order
> data <- within(data,
Class <- factor(Class,
levels=names(sort(table(Class),
decreasing=TRUE))))
> library(ggplot2)
> ggplot(data, aes(x = Class)) + geom_bar()
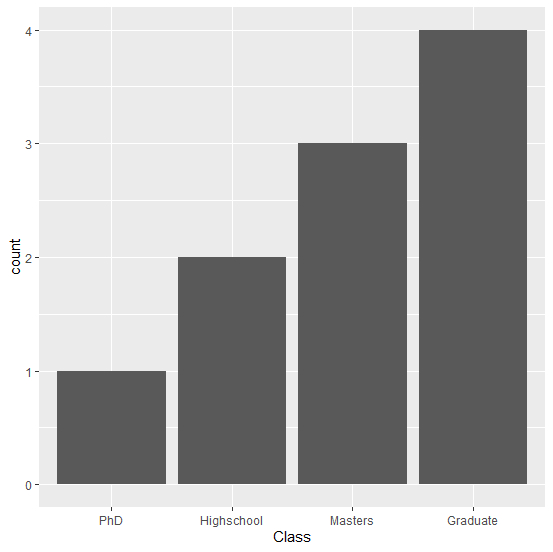
Setting the levels in increasing order
> data <- within(data,
Class <- factor(Class,
levels=names(sort(table(Class),
decreasing=TRUE))))
> ggplot(data, aes(x = Class)) + geom_bar()

Updated on: 2020-07-06T14:21:14+05:30
1K+ Views

Advertisements