
Article Categories
- All Categories
-
 Data Structure
-
 Networking
-
 RDBMS
RDBMS
-
 Operating System
-
 Java
Java
-
 MS Excel
-
 iOS
iOS
-
 HTML
HTML
-
 CSS
CSS
-
 Android
-
 Python
-
 C Programming
-
 C++
C++
-
 C#
C#
-
 MongoDB
-
 MySQL
MySQL
-
 Javascript
-
 PHP
PHP
-
 Economics & Finance
Selected Reading
How to change the size of plots arranged using grid.arrange in R?
To change the size of plots arranged using grid.arrange, we can use heights argument. The heights argument will have a vector equal to the number of plots that we want to arrange inside grid.arrange. The size of the plots will vary depending on the values in this vector.
Consider the below data frame −
Example
x<-rnorm(20)
y<-rpois(20,2)
df<-data.frame(x,y)
df
Output
          x      y
1 2.44725895     4
2 -1.30716203    2
3 -0.98084721    6
4 0.31704022     3
5 1.09460383     2
6 0.76611276     1
7 0.93073818     1
8 -0.84915028    2
9 1.27882442     0
10 0.77428764    1
11 0.48511829    0
12 -1.20333353   0
13 -0.66665709   0
14 -0.12132914   4
15 0.46865269    1
16 0.71771117    1
17 0.76447810    2
18 0.01445573    1
19 -0.75449056   3
20 1.18946339    3
Loading ggplot2 package and creating two plots −
library(ggplot2)
p1<-ggplot(df,aes(x))+geom_histogram(bins=2)
p2<-ggplot(df,aes(x,y))+geom_point()
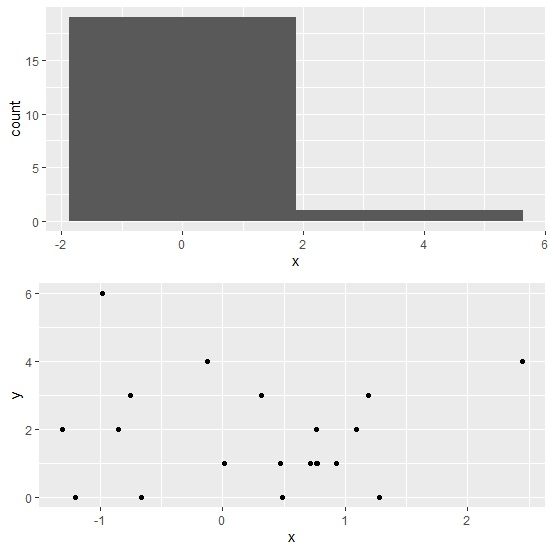
Loading gridExtra package and arranging above plots using grid.arrange −
Example
library(gridExtra)
grid.arrange(p1,p2)
Output
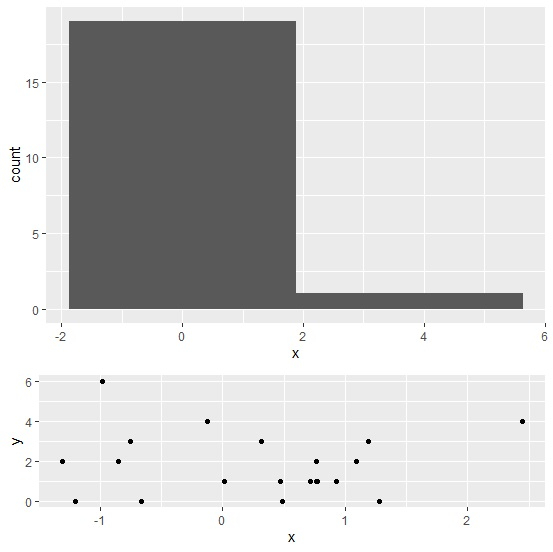
Arranging plots using grid.arrange with varying heights −
Example
grid.arrange(p1,p2,heights=c(2,1))
Output

Updated on: 2026-03-11T22:50:55+05:30
11K+ Views

Advertisements