
Article Categories
- All Categories
-
 Data Structure
-
 Networking
-
 RDBMS
RDBMS
-
 Operating System
-
 Java
Java
-
 MS Excel
-
 iOS
iOS
-
 HTML
HTML
-
 CSS
CSS
-
 Android
-
 Python
-
 C Programming
-
 C++
C++
-
 C#
C#
-
 MongoDB
-
 MySQL
MySQL
-
 Javascript
-
 PHP
PHP
-
 Economics & Finance
Selected Reading
How to change the point size in geom_point conditionally in R?
To change the point size in geom_point conditionally, we can define the condition in geom_point with aes and the size using scale_size_manual function of ggplot2 package. For example, if we have a data frame called df that contains two columns say x and y then the scatterplot with different size of points for x values greater than 5 and less than equal to 5 can be drawn by using the below command −
ggplot(df,aes(x,y))+geom_point(aes(size=x>5))+scale_size_manual(values=c(4,7))
Example
Consider the below data frame −
x<-rnorm(20,6,1.2)
y<-rnorm(20,10,0.3)
df<-data.frame(x,y)
df
Output
         x        y
1   3.328193  10.220022
2   5.230092  9.947973
3   7.870149  9.385716
4   7.250473  10.312204
5   7.859332  9.628415
6   6.344924  9.389630
7   5.950067  9.927424
8   3.598442  10.078970
9   5.243530  9.545237
10  5.546215  10.153369
11  8.037851  9.903173
12  7.607763  10.354359
13  6.264471  10.029382
14  5.604859  10.421269
15  6.053001  9.621305
16  6.778453  9.819948
17  5.570402  9.931298
18  5.046742  10.003627
19  6.783095  9.783940
20  4.774991  10.502797
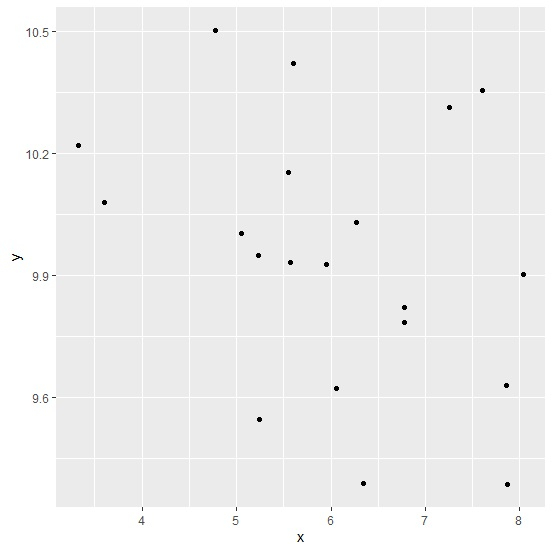
Loading ggplot2 package and creating a scatterplot between x and y −
library(ggplot2)
ggplot(df,aes(x,y))+geom_point()
Output
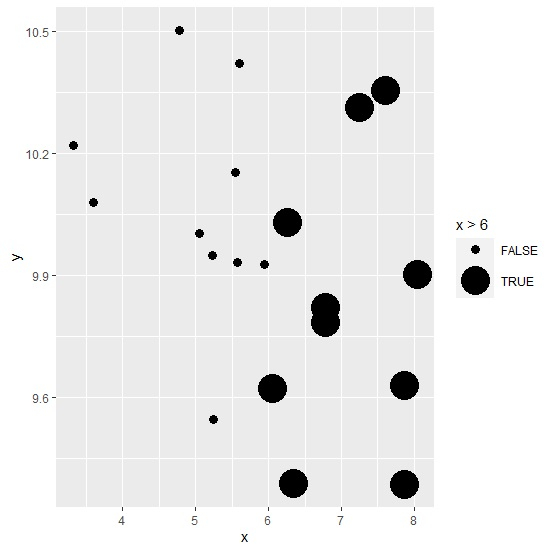
Creating scatterplot between x and y with different point size for x values greater than 6 and less than equal to 6 −
Example
ggplot(df,aes(x,y))+geom_point(aes(size=x>6))+scale_size_manual(values=c(3,10))
Output
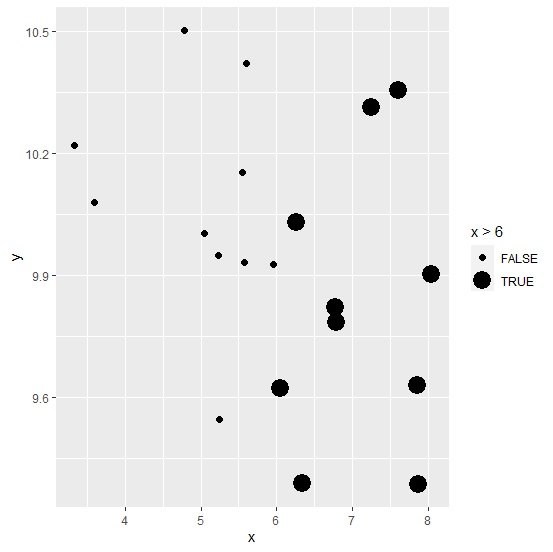
Example
ggplot(df,aes(x,y))+geom_point(aes(size=x>6))+scale_size_manual(values=c(2,6))
Output
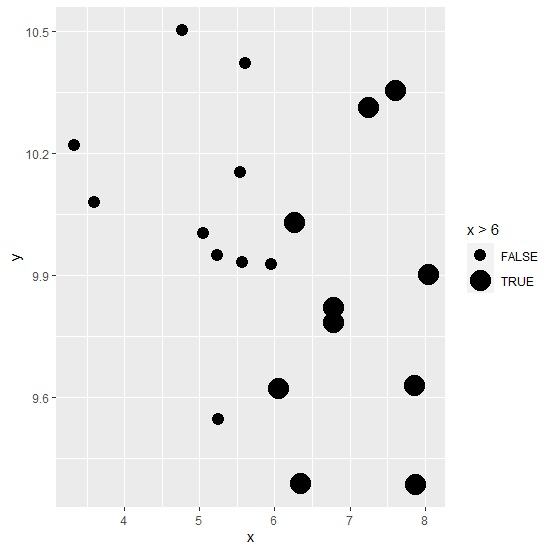
Example
ggplot(df,aes(x,y))+geom_point(aes(size=x>6))+scale_size_manual(values=c(4,7))
Output

Updated on: 2026-03-11T22:50:56+05:30
2K+ Views

Advertisements