
Article Categories
- All Categories
-
 Data Structure
-
 Networking
-
 RDBMS
RDBMS
-
 Operating System
-
 Java
Java
-
 MS Excel
-
 iOS
iOS
-
 HTML
HTML
-
 CSS
CSS
-
 Android
-
 Python
-
 C Programming
-
 C++
C++
-
 C#
C#
-
 MongoDB
-
 MySQL
MySQL
-
 Javascript
-
 PHP
PHP
-
 Economics & Finance
Selected Reading
How to reduce the space between two plots that are joined with grid.arrange in R?
When we join or combine plots using grid.arrange the scales of the first plot comes in between as X-axis even if the independent variable in both of the plots is same.
Therefore, we might want to remove the space between the plots while joining to get only one X-axis. This can be done by using theme function.
Example
Consider the below data frame −
set.seed(123)
x<-rnorm(10,1)
y<-rnorm(10,2)
df<-data.frame(x,y)
df
Output
      x          y
1 0.4395244 3.22408180
2 0.7698225 2.35981383
3 2.5587083 2.40077145
4 1.0705084 2.11068272
5 1.1292877 1.44415887
6 2.7150650 3.78691314
7 1.4609162 2.49785048
8 -0.2650612 0.03338284
9 0.3131471 2.70135590
10 0.5543380 1.52720859
Loading ggplot2 and gridExtra package −
library(ggplot2)
library(gridExtra)
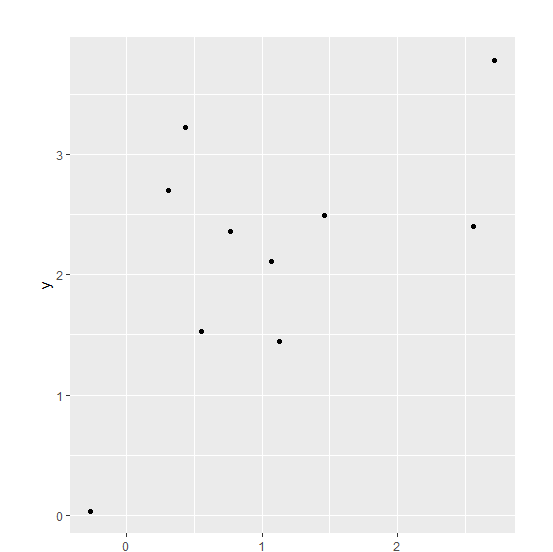
Creating scatterplot and line chart between x and y with plot.margin to reduce the space between the plot when joined with grid.arrange −
Example
Plot1<-ggplot(df,aes(x,y))+geom_point()+theme(plot.margin=unit(c(1,1,-0.5,1),"cm"))
Plot1
Output
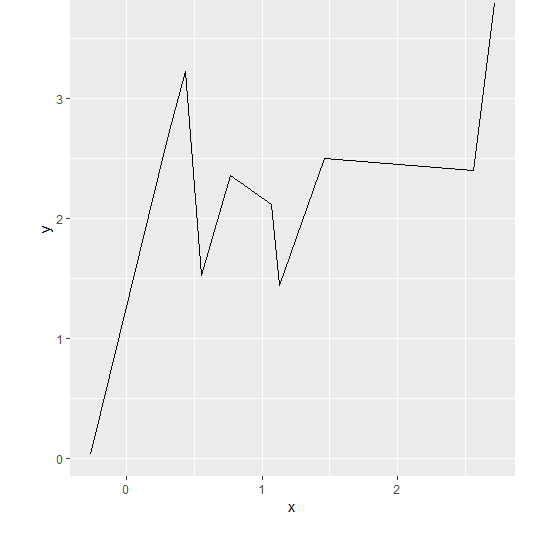
Plot2<-ggplot(df,aes(x,y))+geom_line()+theme(plot.margin=unit(c(-0.5,1,1,1),"cm"))
Plot2
Output
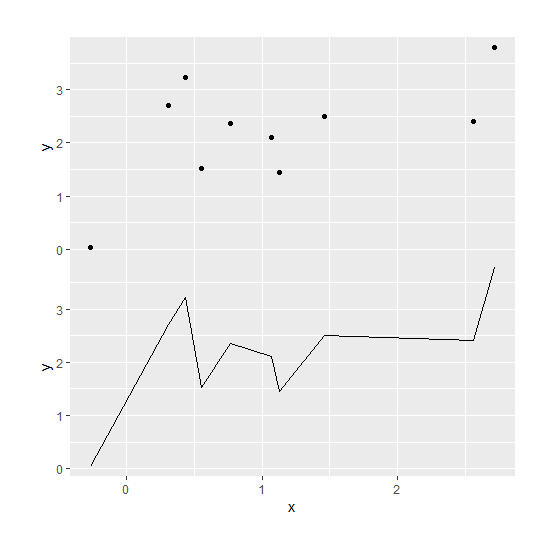
Joining the two plots −
Example
grid.arrange(Plot1,Plot2)
Output

Updated on: 2026-03-11T22:50:51+05:30
2K+ Views

Advertisements