
Article Categories
- All Categories
-
 Data Structure
-
 Networking
-
 RDBMS
RDBMS
-
 Operating System
-
 Java
Java
-
 MS Excel
-
 iOS
iOS
-
 HTML
HTML
-
 CSS
CSS
-
 Android
-
 Python
-
 C Programming
-
 C++
C++
-
 C#
C#
-
 MongoDB
-
 MySQL
MySQL
-
 Javascript
-
 PHP
PHP
-
 Economics & Finance
How to display a list of plots with the help of grid.arrange in R?
In data analysis, we deal with many variables at a time and we want to visualize the histogram of these variables at a time. This helps us to understand the distribution of each variable in the data set, therefore we can apply the appropriate technique to deal with those variables. To create a list of plots we can use grid.arrange function in gridExtra package that can arrange plots based on our need.
Example
Consider the below data frame −
> set.seed(10)
> df<-data.frame(x1=rnorm(10),x2=rnorm(20,0.2),x3=rnorm(20,0.5),x4=rnorm(10,0.5))
> head(df,20)
            x1     x2           x3         x4
1  0.01874617 1.301779503 -1.3537405 0.09936245
2 -0.18425254 0.955781508 0.4220539 0.16544343
3 -1.37133055 -0.038233556 1.4685663 1.86795395
4 -0.59916772   1.187444703  0.6849260   2.63776710
5  0.29454513   0.941390128 -0.8799436   1.00581926
6  0.38979430   0.289347266 -0.9355144   1.28634238
7  -1.20807618 -0.754943856  0.8620872  -0.40221194
8  -0.36367602 0.004849615  -1.2590868   1.03289699
9  -1.62667268 1.125521262  0.1754560   -0.14589425
10 -0.25647839 0.682978525  -0.1515630   0.79098749
11  0.01874617 -0.396310637  1.5865514   0.09936245
12 -0.18425254 -1.985286838 -0.2625449   0.16544343
13 -1.37133055 -0.474865938 -0.3286625   1.86795395
14 -0.59916772 -1.919061192  1.3344739   2.63776710
15 0.29454513  -1.065198022 -0.4676520   1.00581926
16 0.38979430  -0.173661555  0.4711847   1.28634238
17 -1.20807618 -0.487555430  0.7325252  -0.40221194
18 -0.36367602 -0.672158827  0.1987913   1.03289699
19 -1.62667268  0.098238994 -0.1776146  -0.14589425
20 -0.25647839 -0.053780530  1.1552276   0.79098749
Loading ggplot2 package −
> library(ggplot2)
Loading gridExtra package −
> library(gridExtra)
Creating the histograms of x1, x2, x3, and x4 −
> p1 <- ggplot(df, aes(x1)) + geom_histogram()
> p2 <- ggplot(df, aes(x2)) + geom_histogram()
> p3 <- ggplot(df, aes(x3)) + geom_histogram()
> p4 <- ggplot(df, aes(x4)) + geom_histogram()
> PlotsList<- list(p1,p2,p3,p4)
Arranging the plots in one graph −
> grid.arrange(grobs = PlotsList, ncol = 2)
`stat_bin()` using `bins = 30`. Pick better value with `binwidth`.
`stat_bin()` using `bins = 30`. Pick better value with `binwidth`.
`stat_bin()` using `bins = 30`. Pick better value with `binwidth`.
`stat_bin()` using `bins = 30`. Pick better value with `binwidth`.
Output
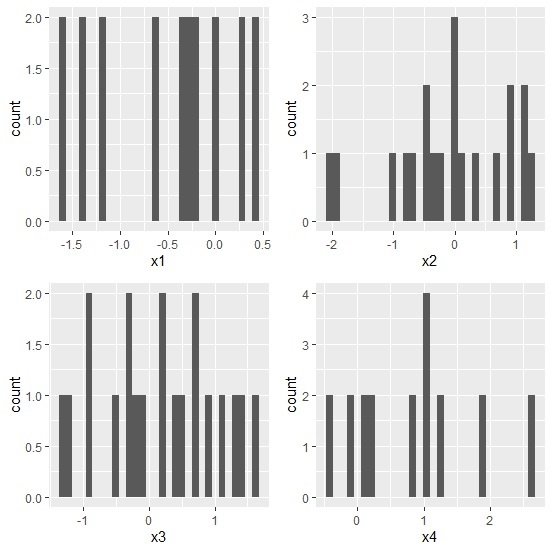
Here R is showing “`stat_bin()` using `bins = 30`. Pick better value with `binwidth`.” with the output but it is not an error, it is just telling us to change the binwidth and we can change it in geom_histogram() as geom_histogram(binwidth=1).

2K+ Views
