
Article Categories
- All Categories
-
 Data Structure
-
 Networking
-
 RDBMS
RDBMS
-
 Operating System
-
 Java
Java
-
 MS Excel
-
 iOS
iOS
-
 HTML
HTML
-
 CSS
CSS
-
 Android
-
 Python
-
 C Programming
-
 C++
C++
-
 C#
C#
-
 MongoDB
-
 MySQL
MySQL
-
 Javascript
-
 PHP
PHP
-
 Economics & Finance
Selected Reading
How to arrange a list of scatterplots in R using grid.arrange?
In predictive modeling, we get so many variables in our data set and we want to visualize the relationship among these variables at a time. This helps us to understand how one variable changes with the other, and on the basis of that we can use the better modeling technique. To create a list of plots we can use grid.arrange function in gridExtra package that can arrange plots based on our need.
Example
Consider the below data frame −
> set.seed(10)
> df<-data.frame(x1=rnorm(10),x2=rnorm(20,0.2),x3=rnorm(20,0.5),x4=rnorm(10,0.5))
> head(df,20)
       x1            x2        x3     x4
1   0.01874617  1.301779503 -1.3537405  0.09936245
2  -0.18425254  0.955781508  0.4220539  0.16544343
3  -1.37133055 -0.038233556  1.4685663  1.86795395
4  -0.59916772  1.187444703  0.6849260  2.63776710
5   0.29454513  0.941390128 -0.8799436  1.00581926
6   0.38979430  0.289347266 -0.9355144  1.28634238
7  -1.20807618 -0.754943856  0.8620872 -0.40221194
8  -0.36367602  0.004849615 -1.2590868  1.03289699
9  -1.62667268  1.125521262  0.1754560 -0.14589425
10 -0.25647839  0.682978525 -0.1515630  0.79098749
11  0.01874617 -0.396310637  1.5865514  0.09936245
12 -0.18425254 -1.985286838 -0.2625449  0.16544343
13 -1.37133055 -0.474865938 -0.3286625  1.86795395
14 -0.59916772 -1.919061192  1.3344739  2.63776710
15  0.29454513 -1.065198022 -0.4676520  1.00581926
16  0.38979430 -0.173661555  0.4711847  1.28634238
17 -1.20807618 -0.487555430  0.7325252 -0.40221194
18 -0.36367602 -0.672158827  0.1987913  1.03289699
19 -1.62667268  0.098238994 -0.1776146 -0.14589425
20 -0.25647839 -0.053780530 1.1552276 0.79098749
Loading ggplot2 package −
> library(ggplot2)
Loading gridExtra package −
> library(gridExtra)
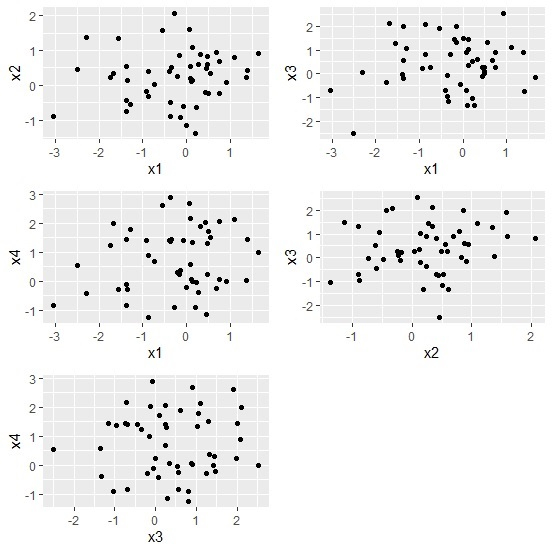
Creating scatterplots among some different combinations of the variables in the data frame that are (x1,x2), (x1,x3), (x1,x4), (x2,x3), (x3,x4) −
> plot1 <- ggplot(df, aes(x1,x2)) + geom_point()
> plot2 <- ggplot(df, aes(x1,x3)) + geom_point()
> plot3 <- ggplot(df, aes(x1,x4)) + geom_point()
> plot4 <- ggplot(df, aes(x2,x3)) + geom_point()
> plot5 <- ggplot(df, aes(x3,x4)) + geom_point()
Creating the list of plots −
> PlotsList<- list(plot1,plot2,plot3,plot4,plot5)
Arranging the plots in a graph −
> grid.arrange(grobs = PlotsList, ncol = 2)
Output

Updated on: 2020-08-10T13:46:12+05:30
608 Views

Advertisements