
Article Categories
- All Categories
-
 Data Structure
-
 Networking
-
 RDBMS
RDBMS
-
 Operating System
-
 Java
Java
-
 MS Excel
-
 iOS
iOS
-
 HTML
HTML
-
 CSS
CSS
-
 Android
-
 Python
-
 C Programming
-
 C++
C++
-
 C#
C#
-
 MongoDB
-
 MySQL
MySQL
-
 Javascript
-
 PHP
PHP
-
 Economics & Finance
Selected Reading
How to change the title size of a graph using ggplot2 in R?
The size of a graph title mattes a lot for the visibility because it is the first thing people look at after plot area. Its size must not be very large nor very small but is should be different from the axis titles and axes labels so that there exists a clarity in the graph. This can be done by using theme function.
Example
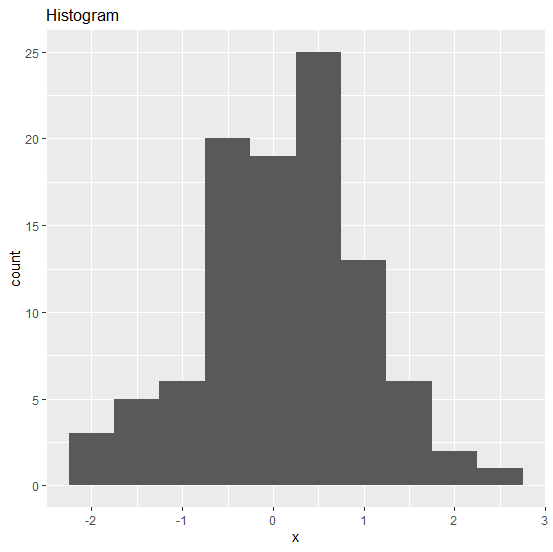
Consider the below data frame −
set.seed(1)
x <-rnorm(100)
df <-data.frame(x)
library(ggplot2)
Creating histogram of x and writing title of the graph −
ggplot(df,aes(x))+geom_histogram(binwidth=0.5)+ggtitle("Histogram")
Output
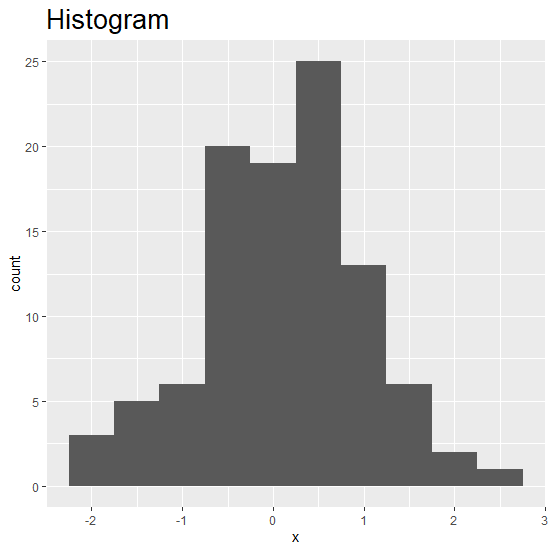
Changing the size of the title
ggplot(df,aes(x))+geom_histogram(binwidth=0.5)+ggtitle("Histogram")+theme(plot.title = element_text(size=20))
Output

Updated on: 2020-08-24T12:01:46+05:30
2K+ Views

Advertisements