
Article Categories
- All Categories
-
 Data Structure
-
 Networking
-
 RDBMS
RDBMS
-
 Operating System
-
 Java
Java
-
 MS Excel
-
 iOS
iOS
-
 HTML
HTML
-
 CSS
CSS
-
 Android
-
 Python
-
 C Programming
-
 C++
C++
-
 C#
C#
-
 MongoDB
-
 MySQL
MySQL
-
 Javascript
-
 PHP
PHP
-
 Economics & Finance
Selected Reading
How to change default point size of geom_point in R?
To change the default point size of geom_point, we need to use update_geom_defaults function. Specifically, for the change of point size the syntax will be as follows −
update_geom_defaults("point",list(size=”value”))
Here, we can change the value according to our need.
Example
Consider the below data frame −
x<-rnorm(20)
y<-rnorm(20)
df<-data.frame(x,y)
df
Output
         x              y
1    -2.01408633     0.69159437
2     0.02908914    -0.35681941
3    -0.07380133    -0.59276801
4     2.55137757    -0.66797607
5    -2.02848239    -0.66251679
6     1.56647463    -0.52278584
7    -0.78294117     1.09368458
8     1.51581007    -1.12097167
9     0.22403361     0.36907139
10   -0.42735230    -0.52032094
11    1.18224730    -0.20402111
12    0.64116560     0.21504714
13   -0.42867756     0.48480990
14    1.40729013    -0.03605021
15    0.01232366     0.28599625
16   -0.66169337    -0.23276426
17   -1.10593041     0.41519239
18   -0.07160152     0.53258766
19    1.33118814    -0.65612553
20    0.18137864    -1.36770919
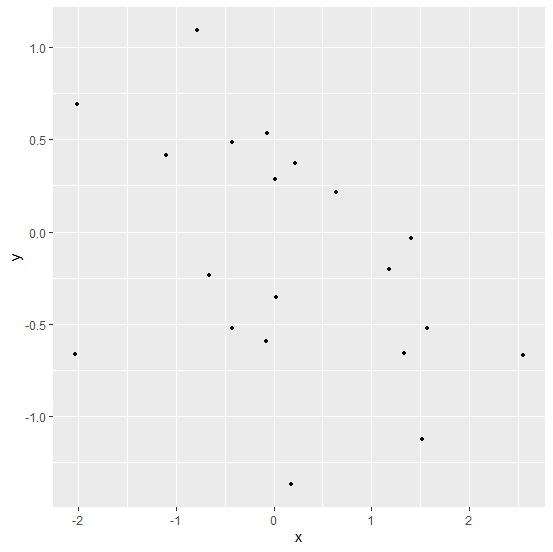
Loading ggplot2 package and creating point chart between x and y −
Example
library(ggplot2)
ggplot(df,aes(x,y))+geom_point()
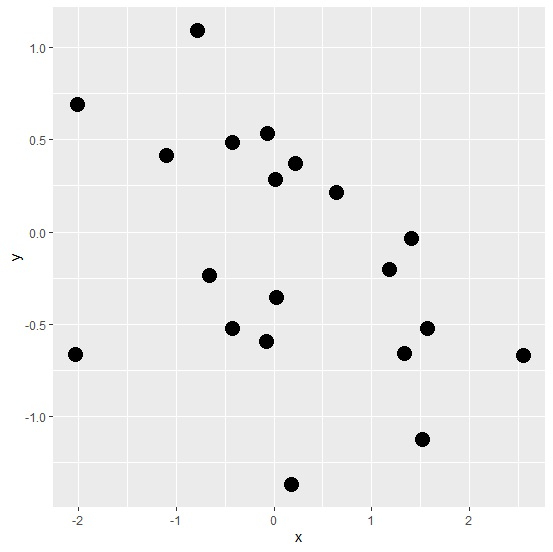
Changing the default for point size of geom_point and creating point chart between x and y −
Example
update_geom_defaults("point",list(size=5))
ggplot(df,aes(x,y))+geom_point()

Updated on: 2026-03-11T22:50:56+05:30
552 Views

Advertisements