
Article Categories
- All Categories
-
 Data Structure
-
 Networking
-
 RDBMS
RDBMS
-
 Operating System
-
 Java
Java
-
 MS Excel
-
 iOS
iOS
-
 HTML
HTML
-
 CSS
CSS
-
 Android
-
 Python
-
 C Programming
-
 C++
C++
-
 C#
C#
-
 MongoDB
-
 MySQL
MySQL
-
 Javascript
-
 PHP
PHP
-
 Economics & Finance
Selected Reading
How to change the size of correlation coefficient value in correlation matrix plot using corrplot in R?
The correlation coefficient value size in correlation matrix plot created by using corrplot function ranges from 0 to 1, 0 referring to the smallest and 1 referring to the largest, by default it is 1. To change this size, we need to use number.cex argument. For example, if we want to decrease the size to half then we can use number.cex = 0.5.
Example
Consider the below matrix −
set.seed(99)
M<-matrix(rpois(100,10),ncol=10)
M
Output
      [,1] [,2] [,3] [,4] [,5] [,6]  [,7]  [,8]  [,9] [,10]
[1,]    10  10   14   14    7    9    14    14    13    10
[2,]    11   8    9    13   9    9     5    12     7     6
[3,]    10  12    6    11   5    8    10     4    11    15
[4,]    11   7   12     9   5   10     7    10    10     9
[5,]     8   8    8    16   8    6     7    14    12     8
[6,]    10   4    5    10   6    8    14     9    14    11
[7,]     7  12    9     4   14  18     7    12    12     9
[8,]    11  16    8     6   18  12     9     9    10    16
[9,]     5   9   11    13   8   10    12    10    10     9
[10,]    7  14   13     9   7   10    10    15    11    16
Loading corrplot package and creating a correlation matrix plot −
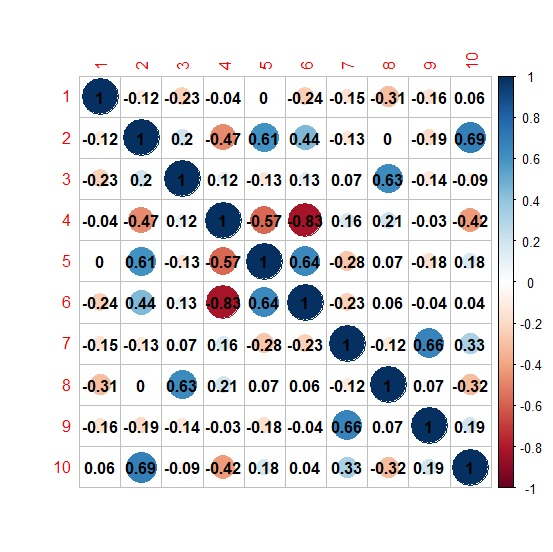
library(corrplot) > corrplot(cor(M),addCoef.col="black")
Output
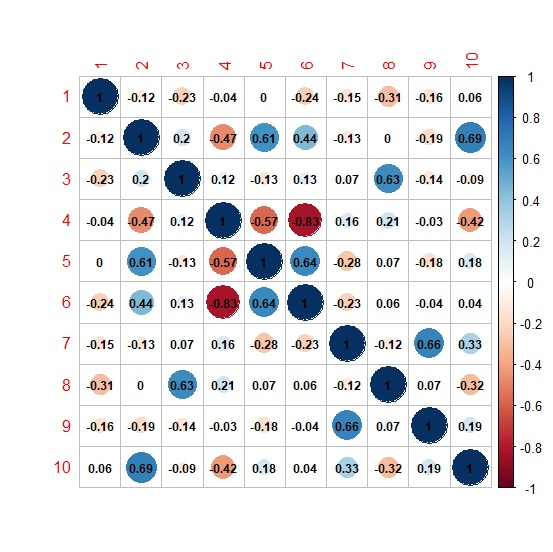
Changing the size of correlation coefficient value to 0.75 −
corrplot(cor(M),addCoef.col="black",number.cex=0.75)
Output
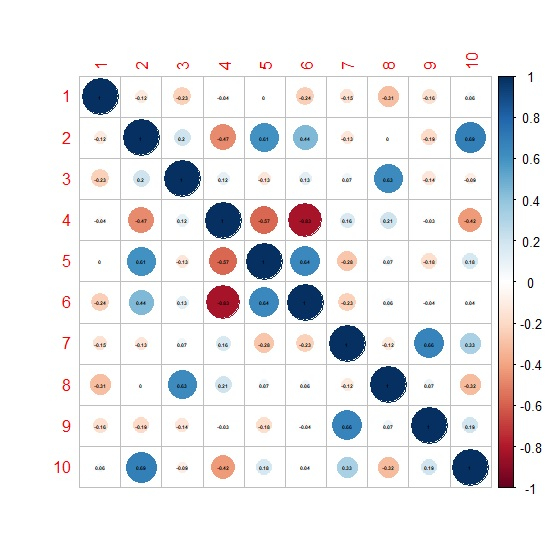
Changing the size of correlation coefficient value to 0.30 −
> corrplot(cor(M),addCoef.col="black",number.cex=0.30)
Output

Updated on: 2026-03-11T22:50:52+05:30
3K+ Views

Advertisements