
Article Categories
- All Categories
-
 Data Structure
-
 Networking
-
 RDBMS
RDBMS
-
 Operating System
-
 Java
Java
-
 MS Excel
-
 iOS
iOS
-
 HTML
HTML
-
 CSS
CSS
-
 Android
-
 Python
-
 C Programming
-
 C++
C++
-
 C#
C#
-
 MongoDB
-
 MySQL
MySQL
-
 Javascript
-
 PHP
PHP
-
 Economics & Finance
Selected Reading
How to create two plots using ggplot2 arranged in a vertical manner in R?
The two plots created by using ggplot2 can be arranged in a vertical manner with the help gridExtra package, we simply needs to use grid.arrange function to do so. For example, if we have two plots created by using ggplot2 and saved in objects p1 and p2 then they can be vertically arranged as grid.arrange(p1,p2)
Consider the below data frame −
Example
set.seed(151)
x<-rnorm(1000,2,0.80)
df<-data.frame(x)
Loading ggplot2 package and creating two plots for x −
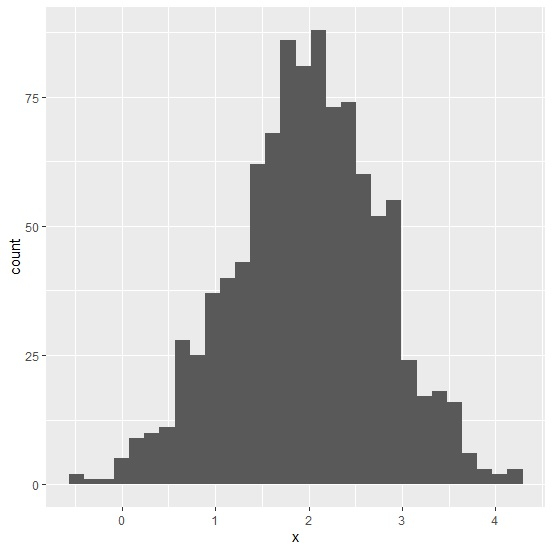
library(ggplot2) ggplot(df,aes(x))+geom_histogram(bins=30)
Output
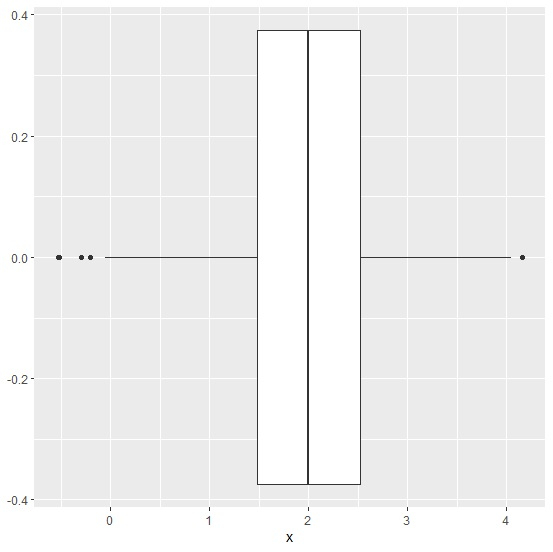
ggplot(df,aes(x))+geom_boxplot()
Output
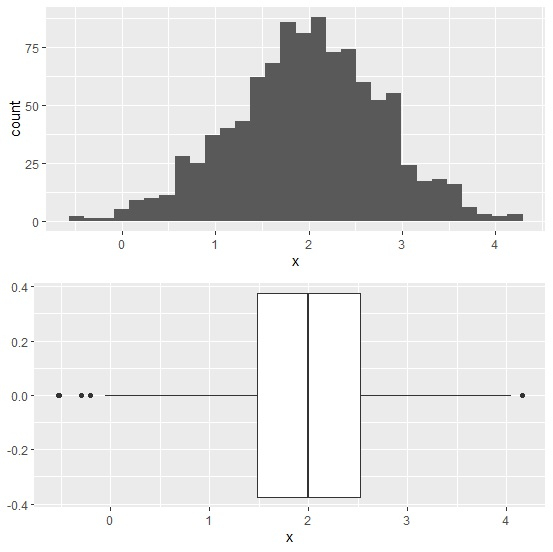
Loading gridExtra package and arranging the two plots −
library(gridExtra)
p1<-ggplot(df,aes(x))+geom_histogram(bins=30)
p2<-ggplot(df,aes(x))+geom_boxplot()
 grid.arrange(p1,p2)
Output

Updated on: 2020-10-09T14:54:43+05:30
725 Views

Advertisements